The named entities and projects do not represent recommendations to buy or sell, or in any way intended to reflect investment advice. One of the key variables that is critical for deciding to invest is missing. That variable is a reasoned forecast of future asset performance vs the market. What is presented attempts to inform and to encourage research, to learn about each asset, and to come to an opinion of whether any of them or all of them strike you as being an important participant in the future development of asset platforms. Charts of technical price levels and movements are presented to educate those unfamiliar with price patterns. These examples of real price activity show how prior price levels may be used to identify market points of price resistance or support. Use this information as you see fit, but it is recommended that you see this as an educational/informative tool only. This information is only part of the array of focus areas needed in making any investment decision, accordingly, it is best to not rely on one type of analysis for your capital allocation decisions.
The Link below will download a Power Point Presentation of the performance of the overall Crypto Asset Market. Additionally, the second section on the Power Point Agenda directs you to the performance of a selected group of tokens representing 105 Blockchain Business Platforms, excluding Bitcoin and Ether, that I call the “105 Portfolio”.
I will continue to add commentary over the foreseeable future to the individual charts to help expand your understanding of what I perceive to be the value that is inherent in each chart. Stay tuned.
Education includes Understanding
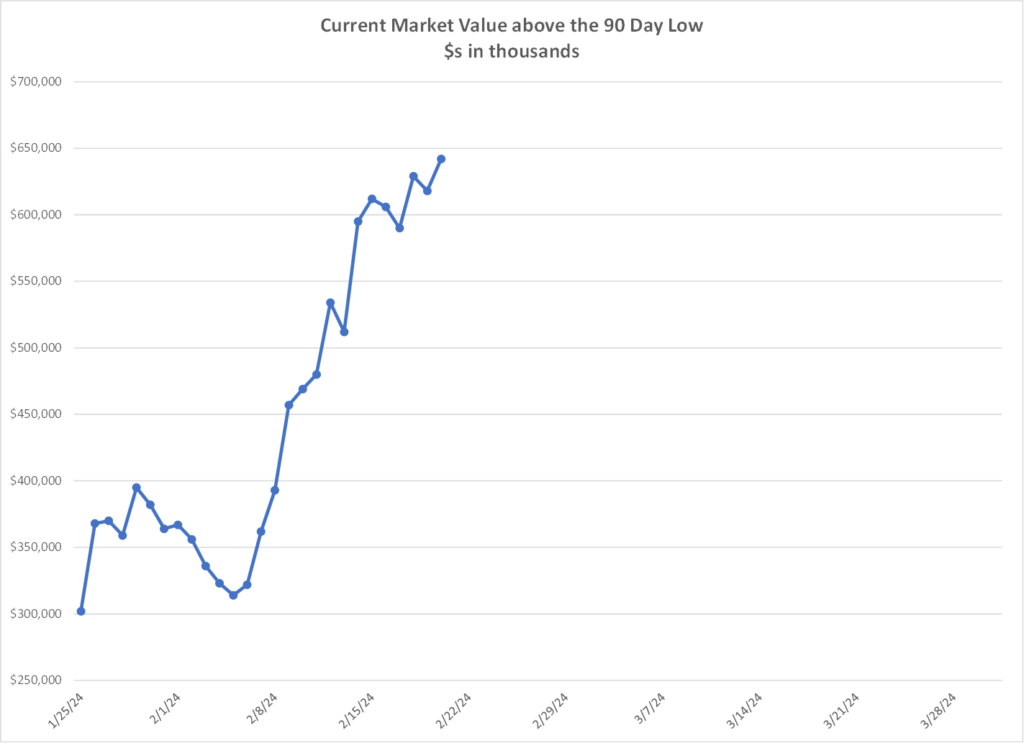 This chart compares each days Market Value to the Market Value low that occurred within the past 90 days. Over time, in a rising market, the low will likely move higher as the prior lower lows are left behind with the bear market. The expansion of the distance is what we should see in the early days of a Bull market. Once we start to see compression take place, that is when serious thinking should be employed about when to exit the market or at the very least a reduction in exposure to potential market declines as the aging Bull gets tired.
BREAK AS INFORMATION BELOW IS NOT CURRENT
This is old information and reflects a point in time that is still meaningful from a factual perspective but is no longer current
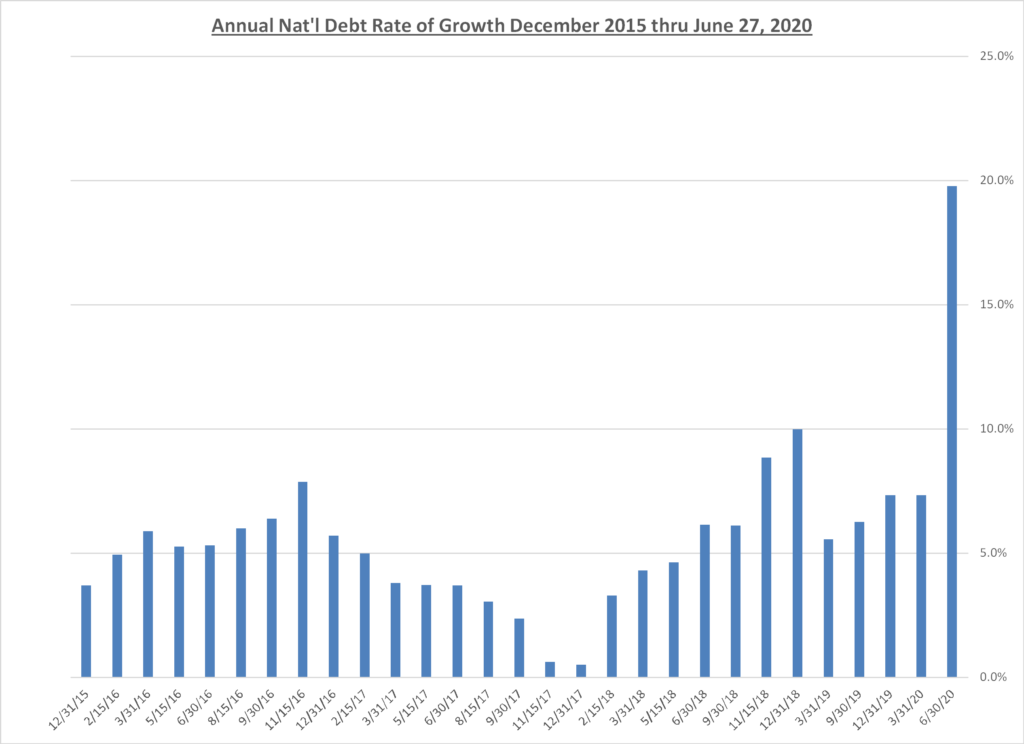
The US National Debt at $26.3 Trillion is simply out of control
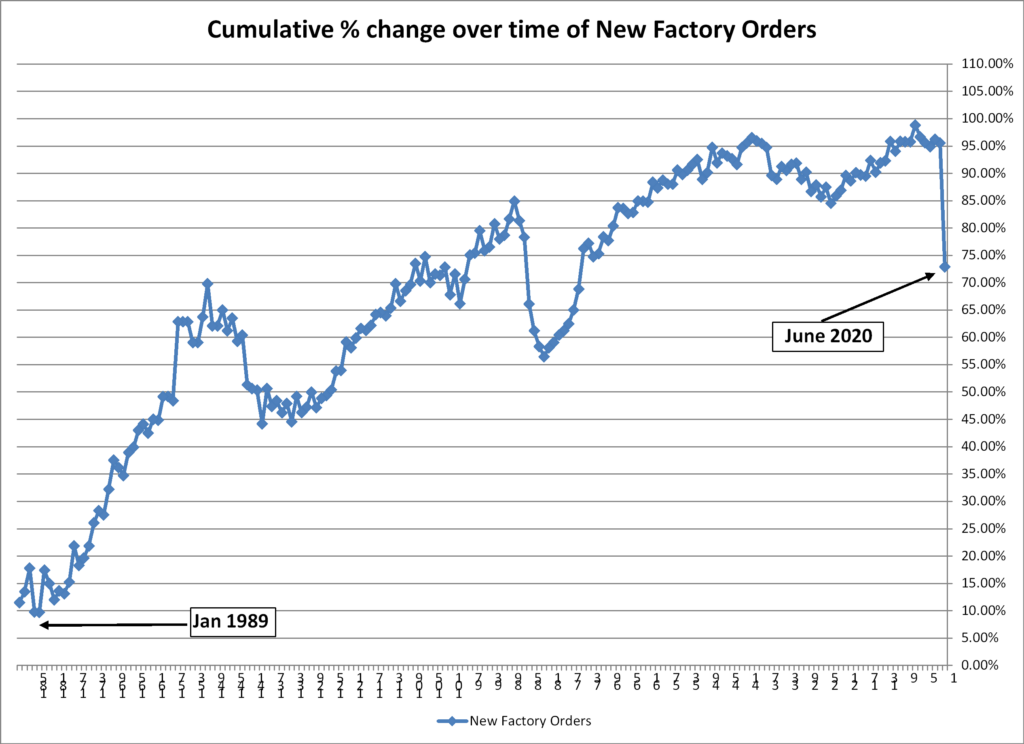
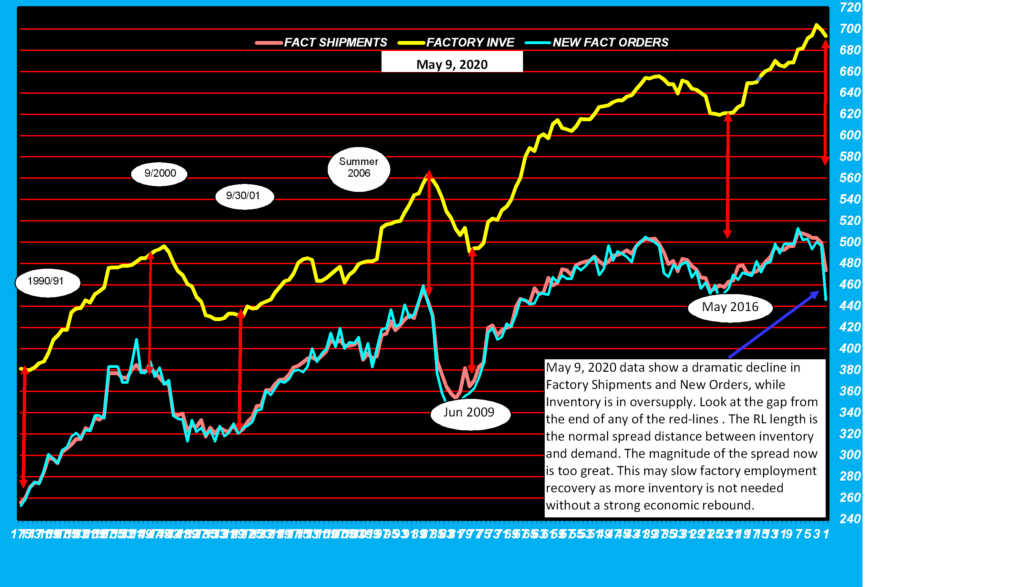
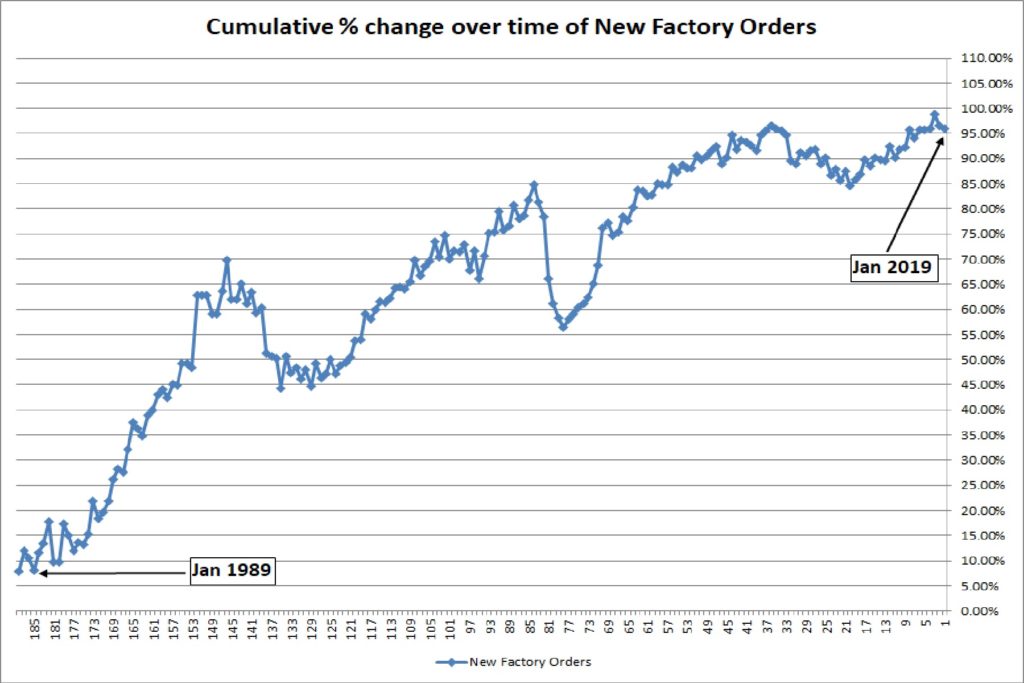
New Factory Orders must reverse if the economy is to rebound.
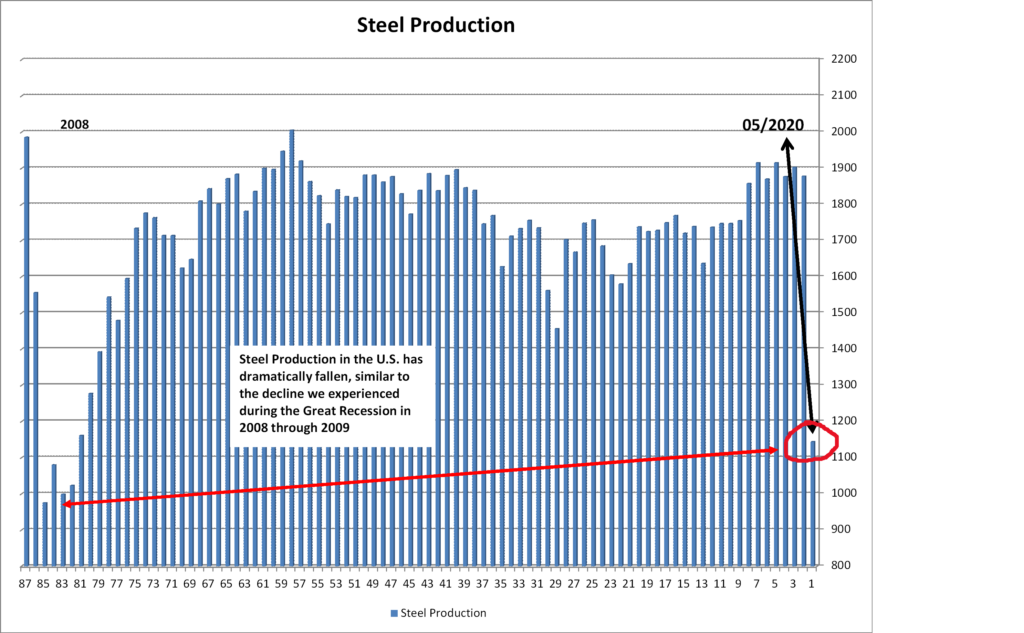
Production of Steel reflects the depth of the economic contraction

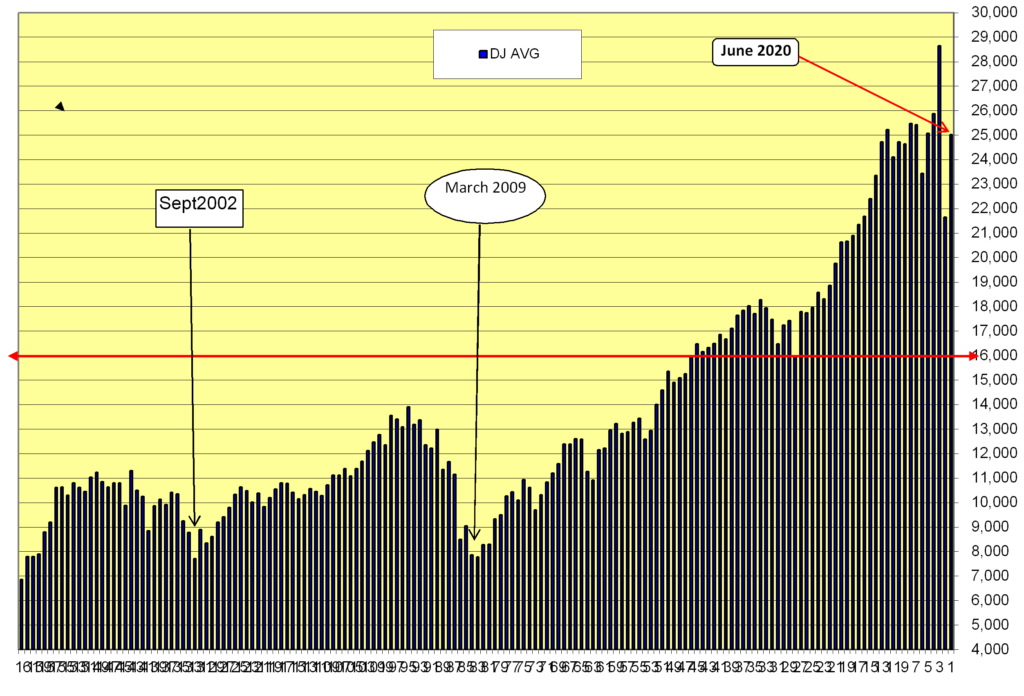
Yet the Stock Market rises
May 9, 2020 and it is time for some charts on the Economy
Be mindful, the charts do not present a pretty picture of the state of the economy. We all hope for a speedy return to “normal” life, and with that a fast pick-up in economic activity. We should be prepared for something different should the economy recover more slowly. I am sharing the data below to give us a clearer picture of how challenging the recovery may be, and if it is more challenging, we should all be very careful and prudent with how we are managing our assets and our emotional well-being.
First up is the key to manufacturing and future pace of rehires once the economy begins to move forward. This is troubling as the spread between inventory levels and new orders/shipments are at historical levels. Inventory needs to burn off for factories to bring back the workforce. If we recover with speed and acceleration, then the burn will be fast and employment will rise quickly, but if we are slow to recover economically, then this excess inventory will be a drag on the economy.
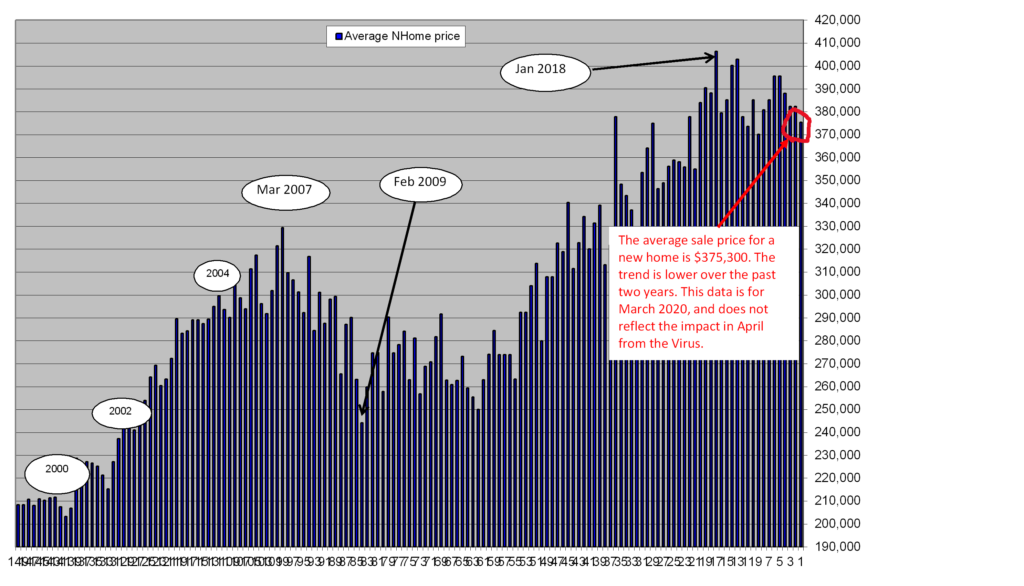
Second up is the U.S. average price for New Home sales. Does have me a bit concerned.
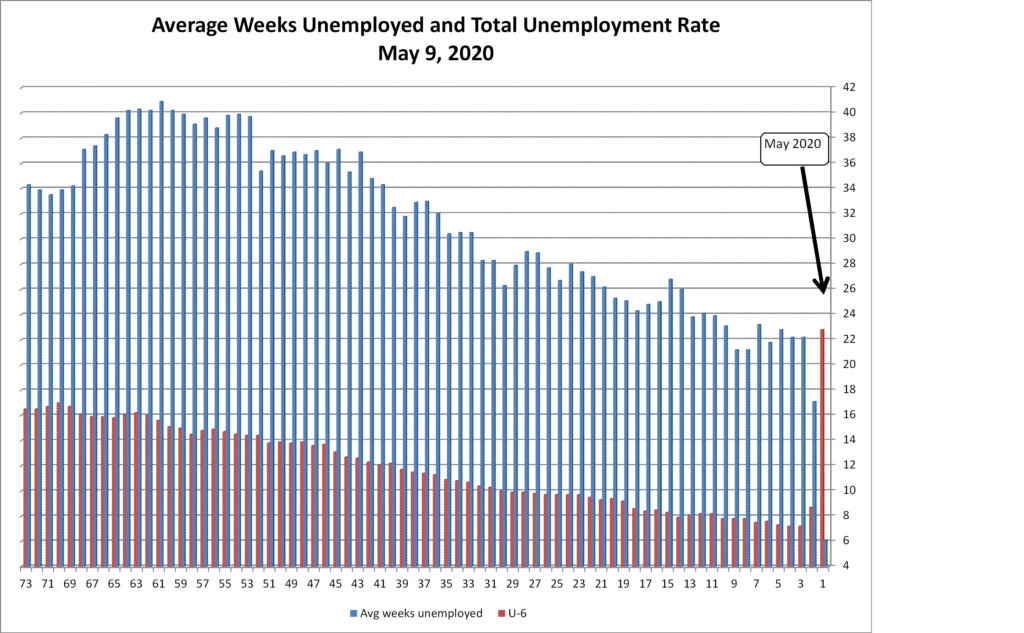
Third up is the current state of Unemployment. The chart shows the average number of weeks people are claiming unemployment insurance and the total unemployment as measure by the U-6 metric. Avg weeks is dramatically lower due to the influx of recent claims, while the U-6 rate is at a record high.
Fourth up is the production of Steel in the U.S. We just got back to the peak level from the year 2007, and we have collapsed in 2020, similar to the fall during the Great Recession.
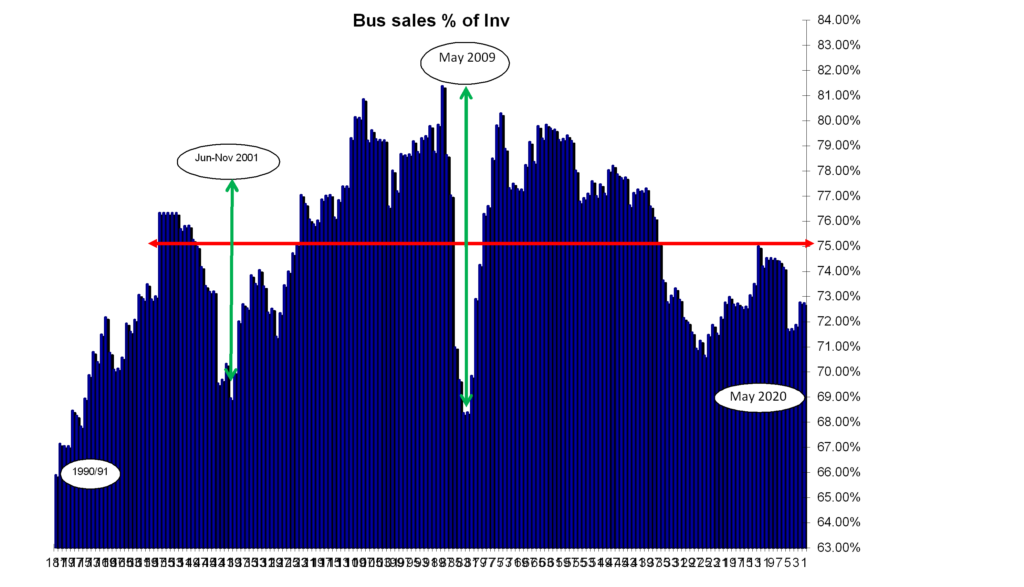
Fifth up is Business Sales vs Business Inventories. Normally, business inventory levels are greater than sales to enable quick shipments to meet unexpected demand and impulse buys. Normally, I would expect this to be above 75%, meaning that sales are running at about +75% of inventories. Rising %s and above 75% tell us we have an expanding economy. Falling %s and a level below 75% tells me we have shelves that are too full, and a likely slowdown in the economy is coming. The data presented does not yet reflect April data. Regardless, we can see that even before the virus effect, inventories were already building beyond what I would consider normal. April data will likely show a continued deterioration, which would require a V shaped recovery to work off the excesses. That may be a challenge if we recover slowly from the economic contraction brought exacerbated by the virus.
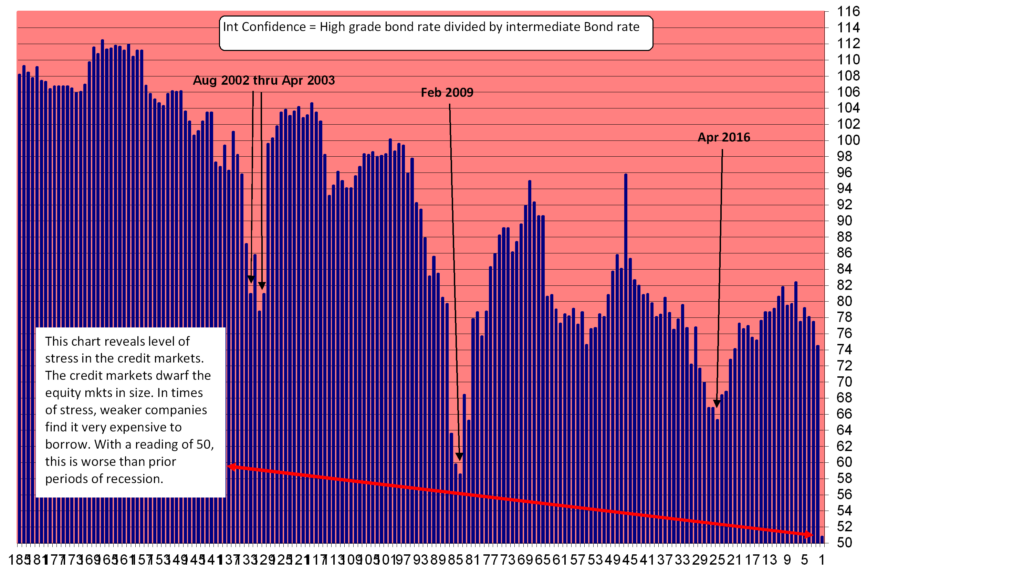
Sixth up is the cost of borrowing. Right now the credit markets are in a very difficult place. Strong companies should be fine, but the weaker companies are finding the cost of money to be too expensive or not available at all. It is why we are starting to see bankruptcies increase, as the lifelines from banks gets pulled.
May 5, 2020. The market is poised for a good up day as of 9:28 AM EST. The liquidity within the market as provided by the FED and the Government is finding its way into Stocks and other assets. I expected the benefit would be felt coming off of the March 23rd lows, and believed that the April 17th interim high was the level that would lead to the next turn lower. Yesterday, we closed within 1/10 of a % point of the April 17th high. This morning it looks like we are heading to the 300 point gain area, showing a desire to own stocks. My desire to preserve capital is greater than my desire to put more money at risk in this environment, so I am not one of the buyers today.
Why am I reticent?
- 45% of the equities I track are still below their prices set on April 17th
- 39% of the equities I track are priced above their Discounted Cash Flow price (the historical average is 35%)
- The current price to cash flow multiple is 25X, while the historic average is 18X
- The analysts cash flow growth for the year 2020 has been reduced to +3.12% over 2019. I believe that the Cash Flow growth will be negative for 2020 given the global economic freeze through the supply chains that will take months to correct.
Having noted the reasons above, I must admit that I have been proven wrong many times by the market when it has ignored the data and simply risen based on TINA, (there is no alternative). TINA forces money into stocks as a better choice vs sitting on cash or buying very low yielding bonds.
Time will tell……………………………….
The Buy Sell Barometer remains in “unfriendly” territory
May 3, 2020. The sell-off on Thursday and Friday of last week is troubling. We had been rallying to a new interim high off of the March 23rd lows. The decline that brought us to the close on Friday, brought us to the level we closed at on the last interim high set on April 17th. All things being equal, I would expect the individual stock pricing within the 187 Portfolio to roughly approximate the prices on April 17th. However, I find that 53% of the 187 Portfolio stock prices are below the prices they closed at on April 17. This is a weak rally in a bear market that failed on Thursday and Friday. Monday may be a very difficult day in the market as it is very possible that we get follow-thru to the downside. The interim bottom set on March 23rd is 600 S&P 500 points lower than where we closed on May 1, 2020, this past Friday. There is a big downside risk here. Accordingly, on Friday I purchased some insurance in the form of S&P 500 Put Options.
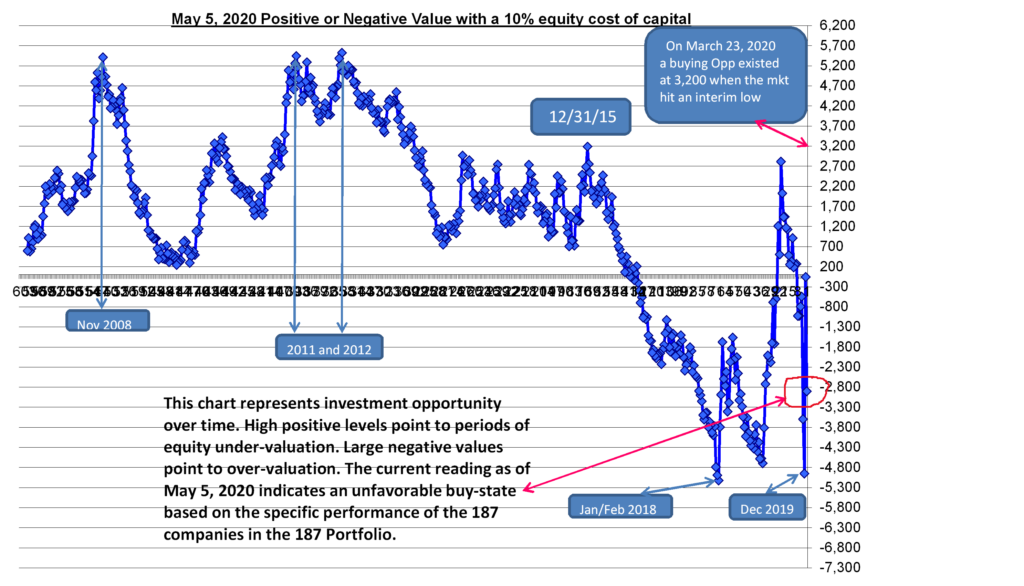
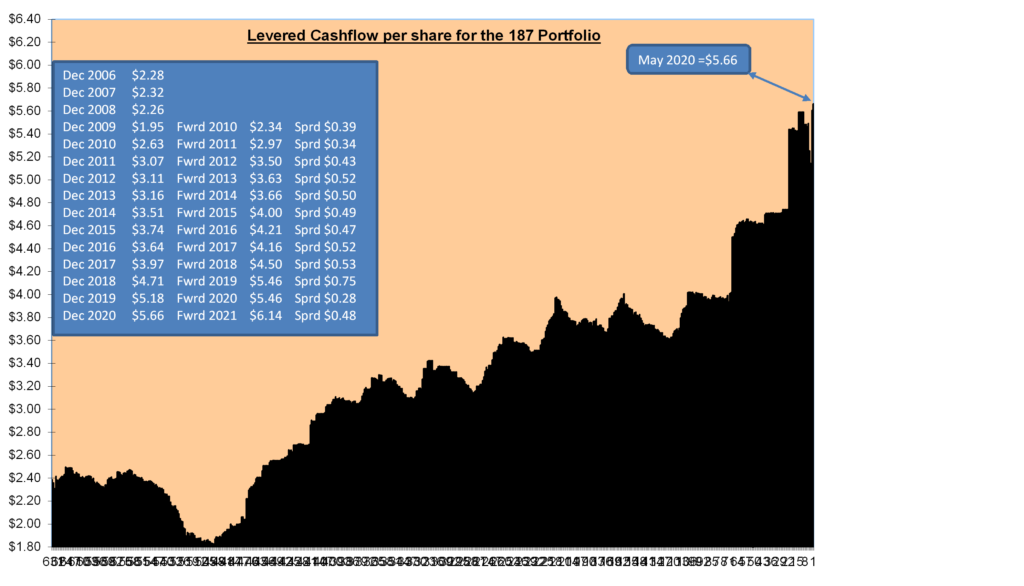
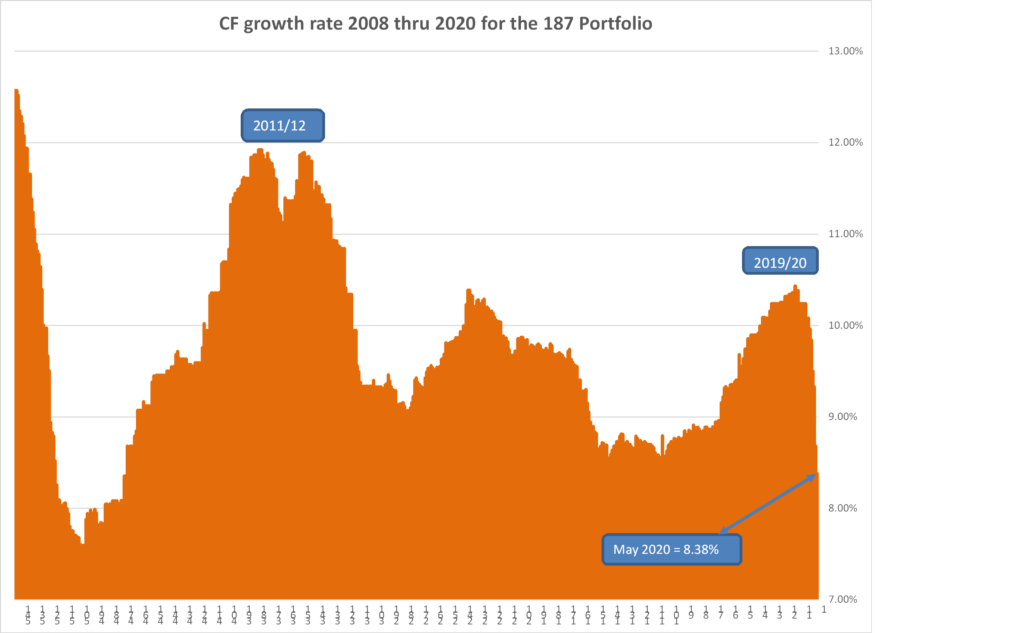
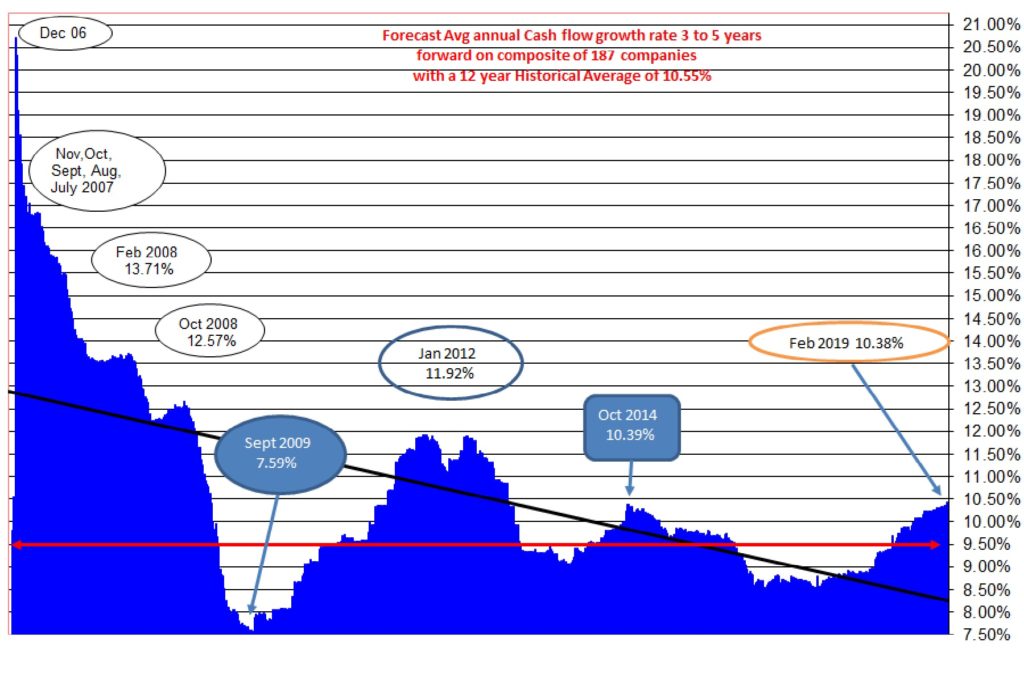
The charts below continue to reflect concerns for the market value. One new chart for you to contemplate shows the cash flow per share of the 187 Portfolio for each year going back to 2006. The growth is significant, but of great concern to me is what appears to be analyst over-estimates of the 2020 and 2021 cash flow per share forecasts. On that chart, you can see for each year what was forecast for the following year. Rarely are those forecasts matched by the actual results. You can see this by comparing the chart value in the right hand column with the next line down on the left, where you can see how the actual results came out. The growth forecast still for 2020 does not make sense to me given the economic shutdown. Study these charts and come to your own conclusions, but I remain patiently on the sidelines, holding Gold Miners, Crypto, Cash, and an under-weighting of stocks of approx. 10% of my asset allocation. I also added protection with the S&P 500 Put Options.
 Based on Analyst forecasts at the time presented

April 29, 2020 and the equity buying continues with no regard for the growth needed to maintain a reasonable risk reward relationship.
How much of a decline in cash flow should one assume will take place in the year 2020 for the companies underlying the world’s stock markets? Clearly, the lost economic activity for two or so months, and a gradual recovery seems to be the best to expect at this juncture. That tells me we should see at least a 20% decline in 2020 cash flows from the 2019 levels. With the rise in current prices of equities off of a 20% decline in cash flows, the improvement in 2021 from 2020 would need to be 42.38% growth in order to maintain a price to cash flow multiple of 18.23X. Now consider this, that after the 2008 Great Recession, the rate of annual growth in cash flows for the next two years never made it into the double digits. In fact the best annual growth in cash flow since 2008 was roughly 12%. Is it reasonable to expect 2021 cash flows to grow by 42.38% over 2020? Something to think about, afterall, the price of a stock should reflect the cash an investor should expect the company to generate as that is the return on investment we all seek, dividends and price appreciation from cash flow growth from operations.

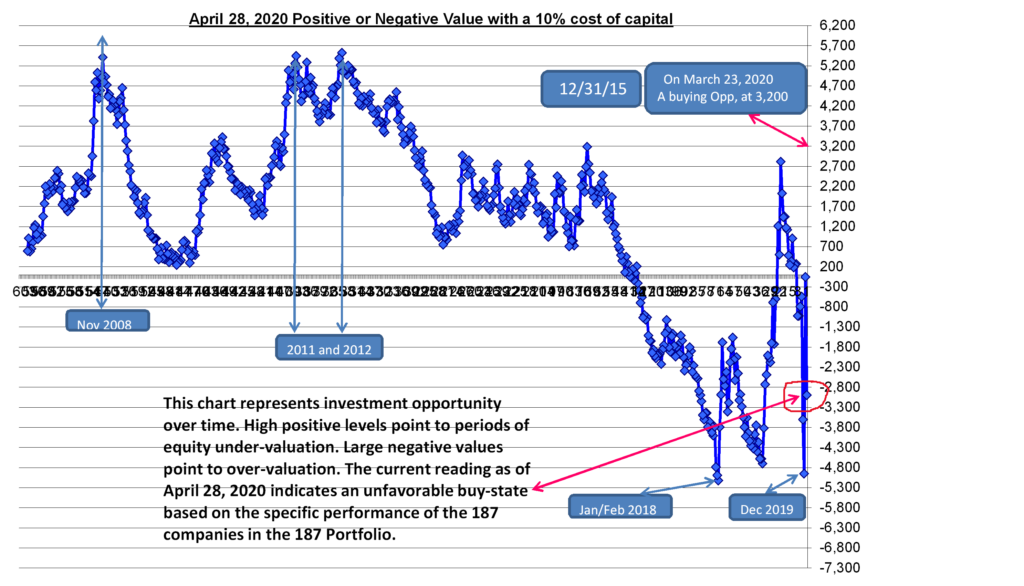
April 28, 2020 This morning the equity market has opened with strength. My assessment is that this is an area where I cannot commit money to the market for it appears to be close to extreme over-valuation.
April 22, 2020 The equity market, the gold market and the crypto market are in rally mode. Gold is up $40 per ounce or 2.4%. Stocks of the Gold Miners are higher, with Newmont Mining (NEM) hitting an all-time high. BTC is trading in the $7,100 area and needs to break resistance that I see at $7,500. If it clears that with some distance, say by $100 to $200, then $9,500 is the next point to get over. Equities are showing strength, but I still do not trust this rally which is happening off of the latest stimulus from the U.S government and from governments around the world. The 187 Portfolio of up 1.4%, while th DJIA and the S&P 500 are up 1.8% and 2.0%, respectively.
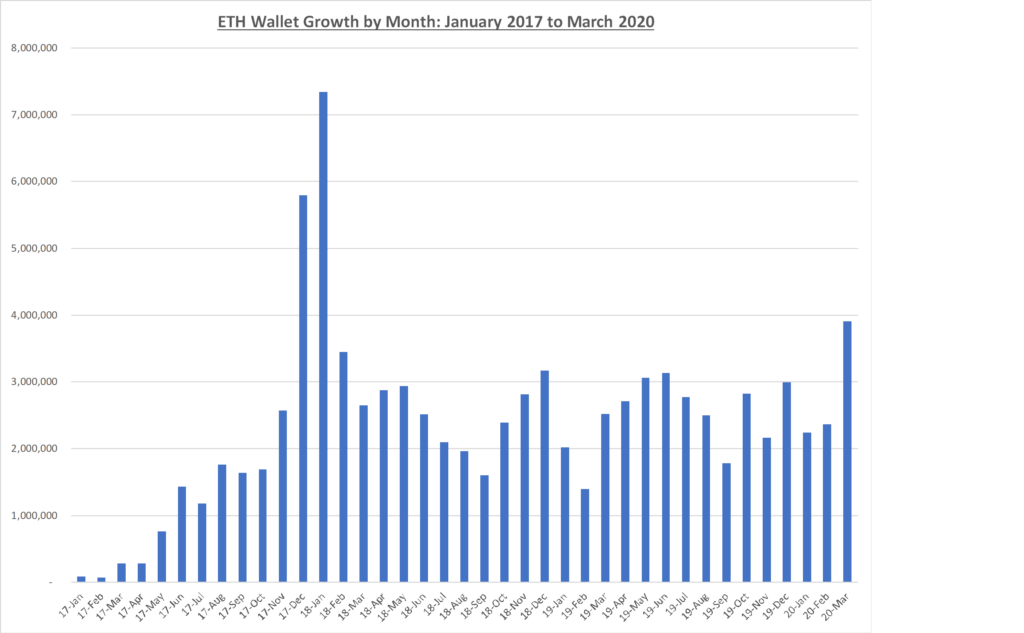
April 20, 2020 ETH Futures and Wallet growth for both BTC and ETH are strengthening

April 18, 2020 Charts on Bitcoin, and Ethereum
April 17.2020: Wallet growth for Bitcoin and Ethereum are showing positive trends


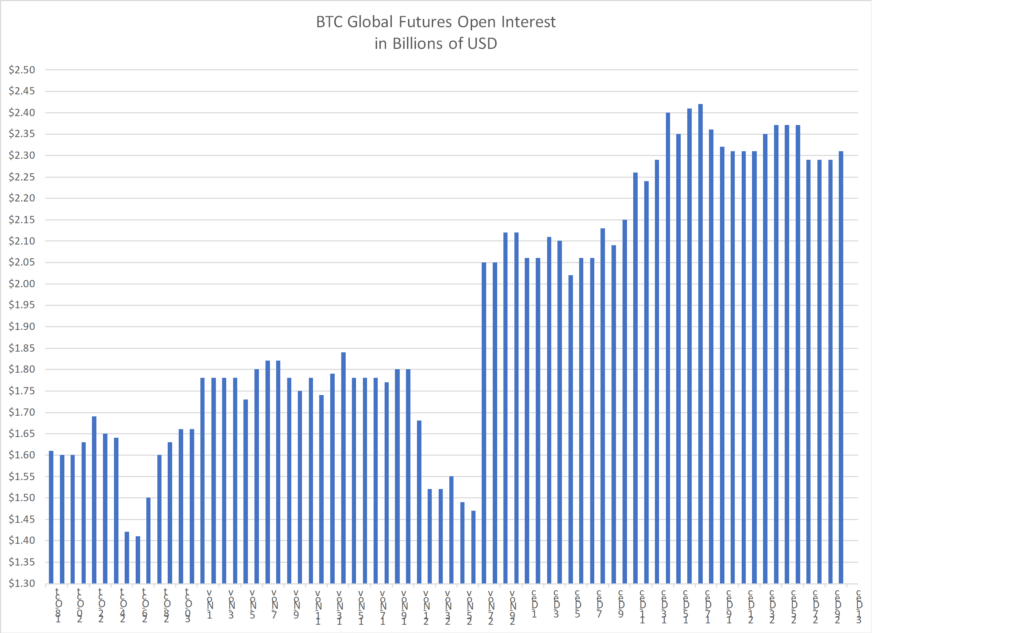
- Futures may be showing signs of institutional buying once again


- The Radar Fund share price through April 3, 2020 reflects a Y-T-D return of 8.96%

- The 93 equally weighted assets that are included in the Radar Fund have a Y-T-D return of negative 6.68%.
The difference between the Radar Fund Y-T-D return and the equally weighted return reflects the decisions made to allocate more investment monies to the most promising assets

- In the world of Futures, there is a significant change that occurred over the last 24 hours.
Open interest in both Bitcoin and Ether Futures continues to reflect a lack of commitment by hedge funds and other non-retail investors. The significant change to note is the level of trading taking place in the Futures market. BTC futures traded globally grew from $13.2 billion to $18 billion, while ETH futures traded globally grew from $1.5 billion to $2.2 billion. This trading volume occurred while the prices of both BTC and ETH were rising.


Took an equity pause. The stock market has declined over 400 DJIA points and 45 S&P 500 points as of noon today. I needed to review my 187 Portfolio holdings for any compelling buy set-ups. I did buy a number of stocks, very small additions, as I continue to build during this stressful time for the day when we will have defeated the Covid-19 virus. Now back to the world of Crypto.
I like to look at Cryptocurrency prices on a daily and ten-day basis. Daily highs and lows for Bitcoin and Ether priced in U.S. Dollars are showing some constructive foundation building. The rising price level of daily highs and daily lows in terms of closing prices for each day over the past three to four weeks is a source of comfort.


End of April 3, 2020 Chart Posting
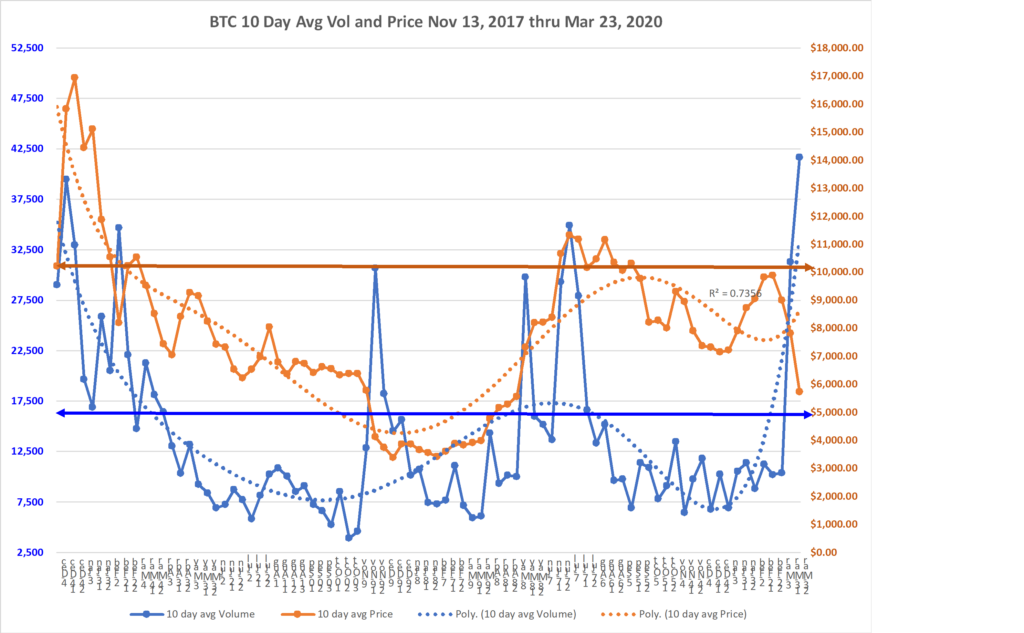
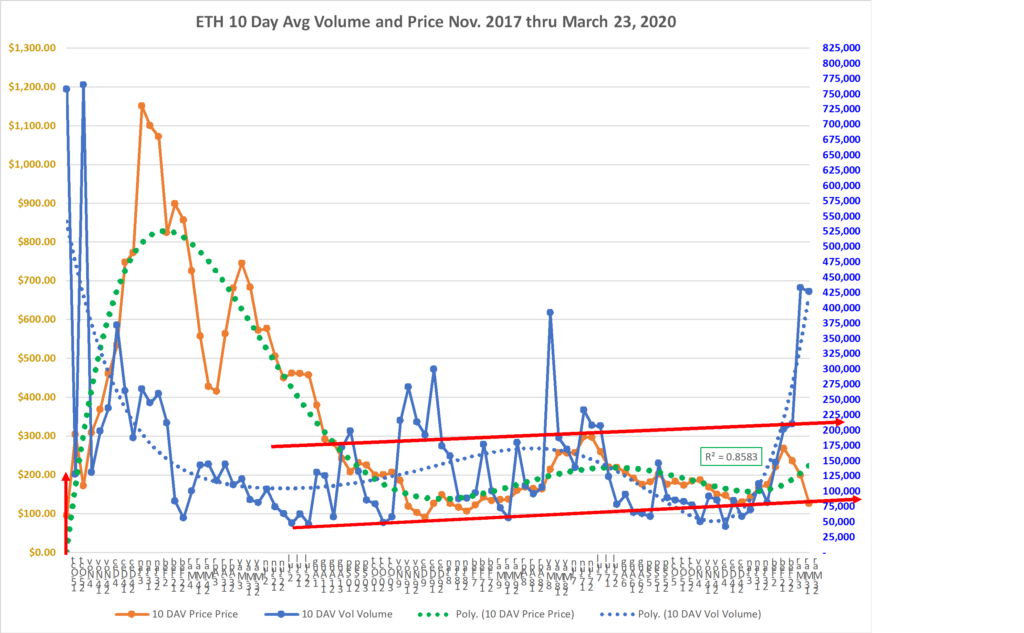
Current Charts as of March 23, 2020 of price, trading volume, futures and wallet growth for Bitcoin and Ether are presented below. The data is positive. While the stock, bond and FX markets have been exceptionally volatile, the BTC and ETH markets are less so in regard to price. Volume is exceptionally high, and new wallet addresses are expanding at an encouraging rate.
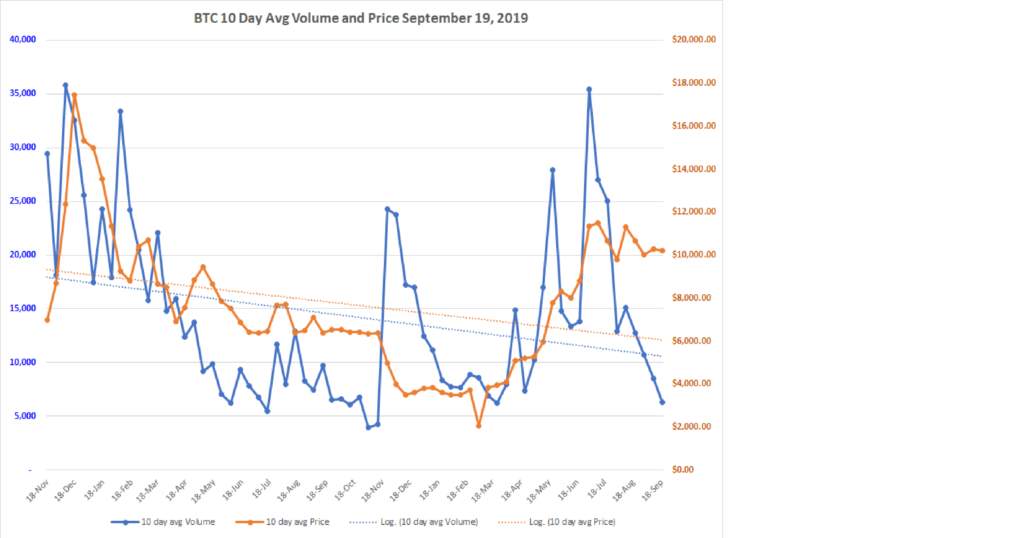
Bitcoin 10-Day avg volume and price. Note the polynomial trend remains in an upward trajectory.
Ether 10-Day avg volume and price. Note the polynomial trend remains in an upward trajectory.
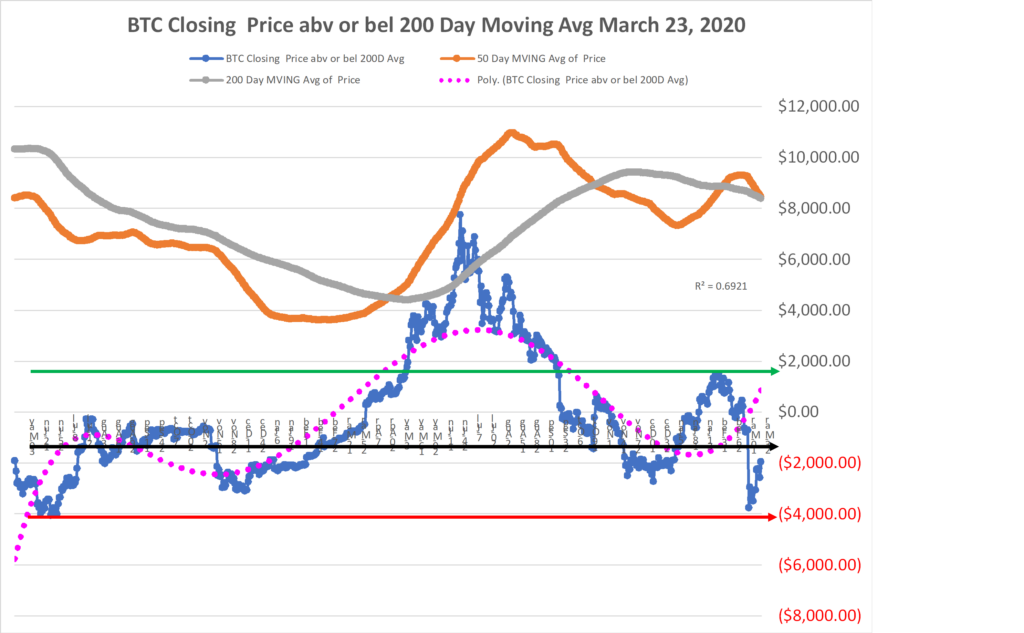
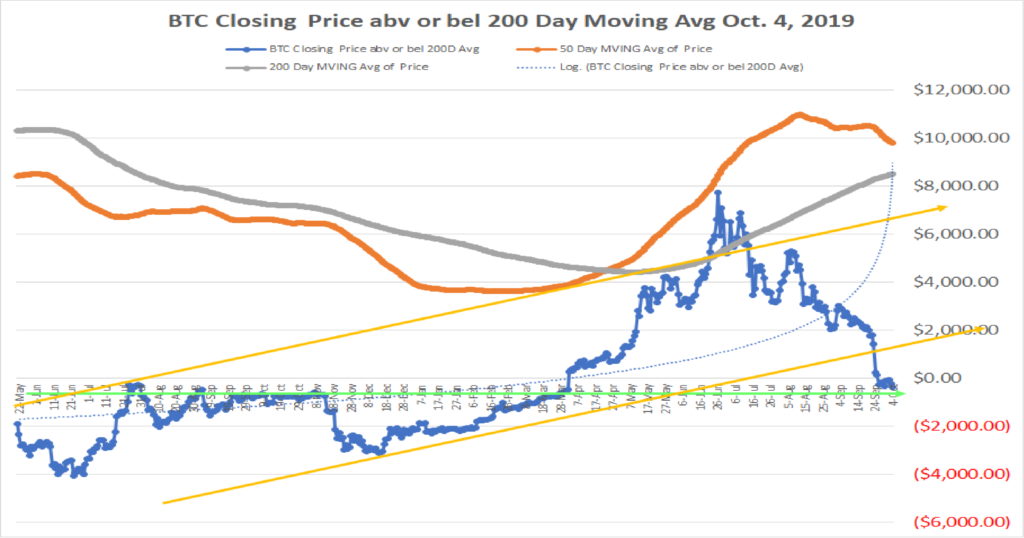
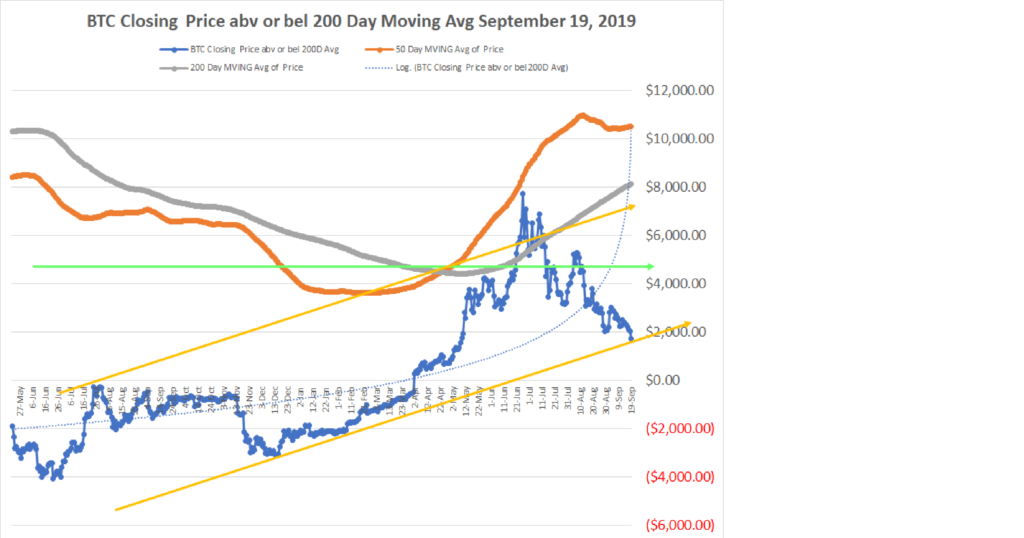
Bitcoin 200-Day and 50-Day moving averages of price, with current price trend vs the 200-day moving average
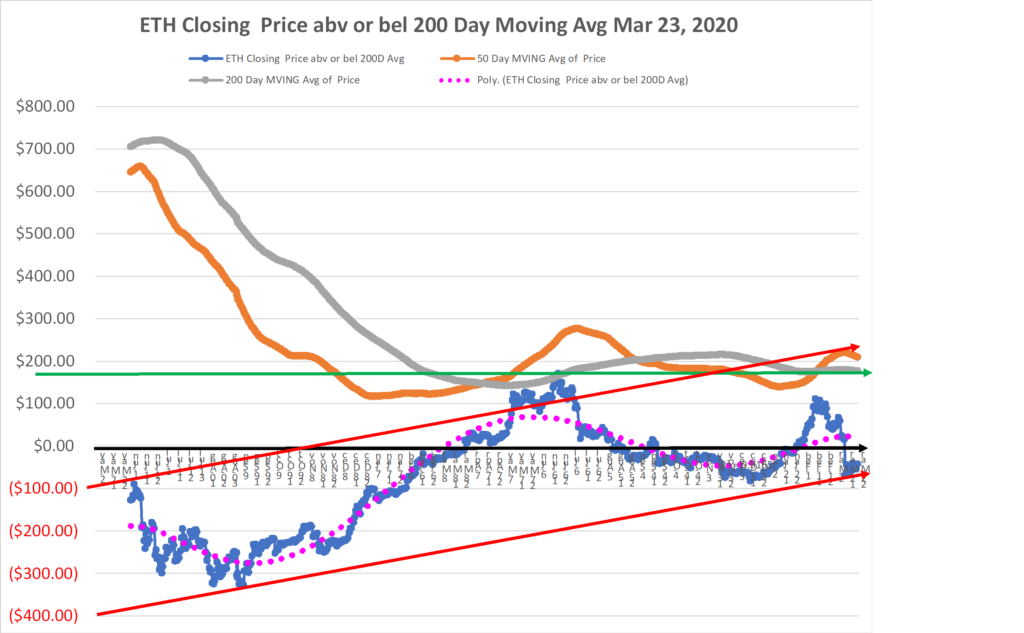
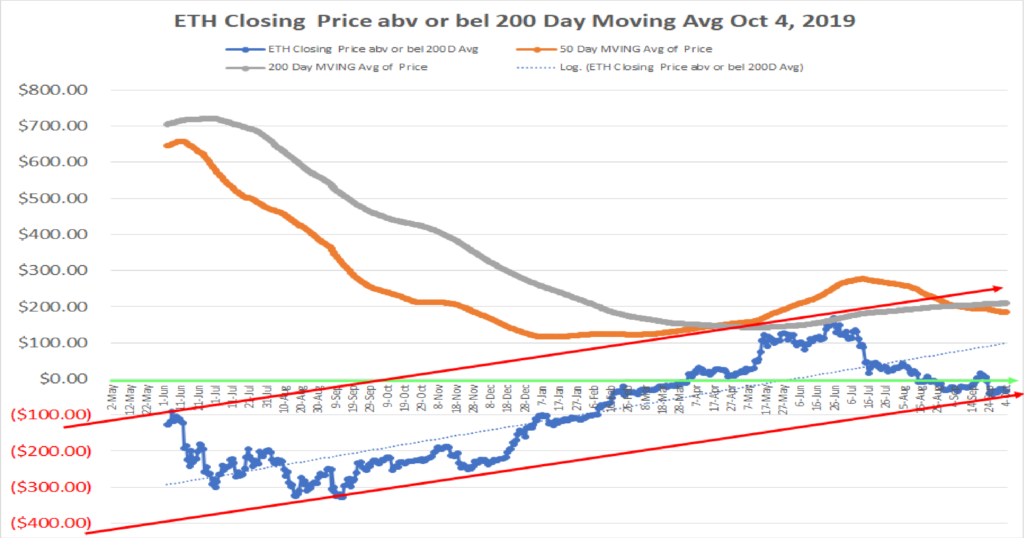
Ether 200-Day and 50-Day moving averages of price, with current price trend vs the 200-Day moving average
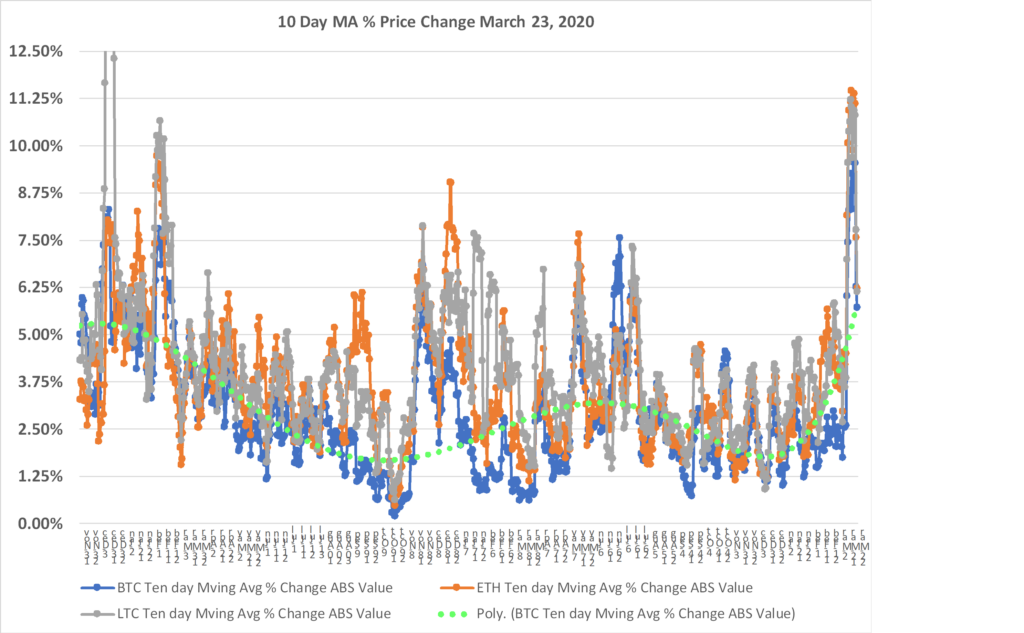
Crypto price volatility
This chart reveals that the recent price moves are steadying as the volatility measure comes down from its recent peaks.
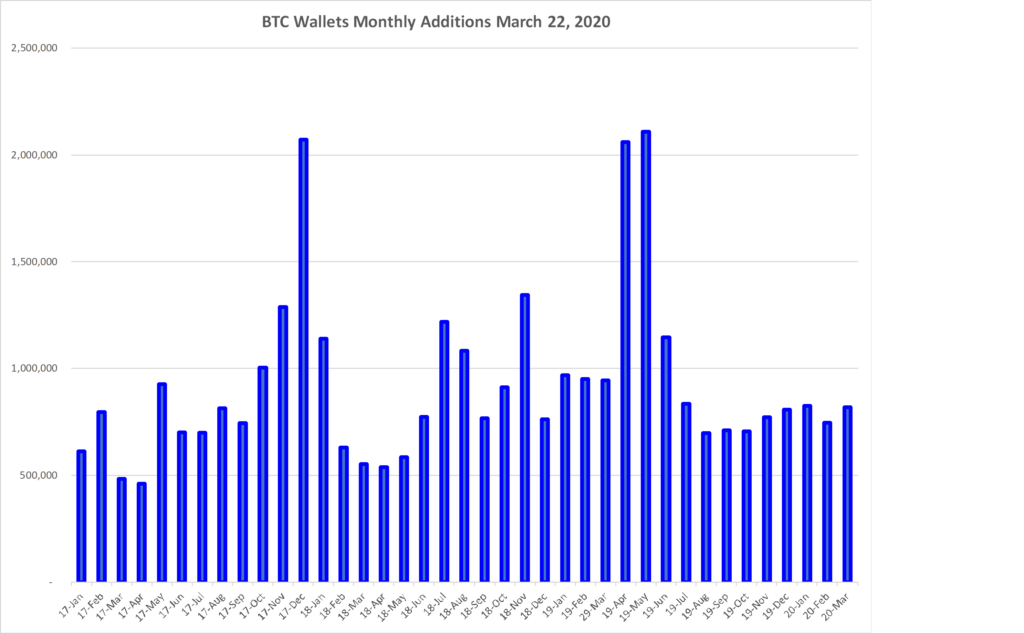
Bitcoin Wallet growth is consistent and growing
Ethereum Wallet growth is expanding in an upward faster pace.
MARCH 9, 2020 charts
Price to Cash FLow Multiple
Assuming a 10% decline today in the stocks that comprise the 187 Portfolio, the Price to Cash Flow multiple moves closer to the Long-term average, but remains above the historic average and the lows set at prior market bottoms.

Price to Discounted Cash Flow Price
Comparing the 187 Portfolio Price to its Discounted Cash Flow Price reveals relative parity. Buying opportunities exist when the DCF price is above the Current price. Selling opportunities exist when the Current Price exceeds the DCF price.

Ether looks like it is ready for a break-out to higher price points

Bitcoin: I have added the Polynomial Trendline that exhibits a correlation of 80% with the price data. Trend higher remains in place

Ether

LiteCoin

Strength begets Strength
There are market dynamics that are moving in unison, re-enforcing each other as the price of crypto-assets move higher.
BTC Highs and Lows in price

ETH Highs and Lows in price

200-day moving average vs 50-day moving average is approaching a cross-over point that is typically bullish


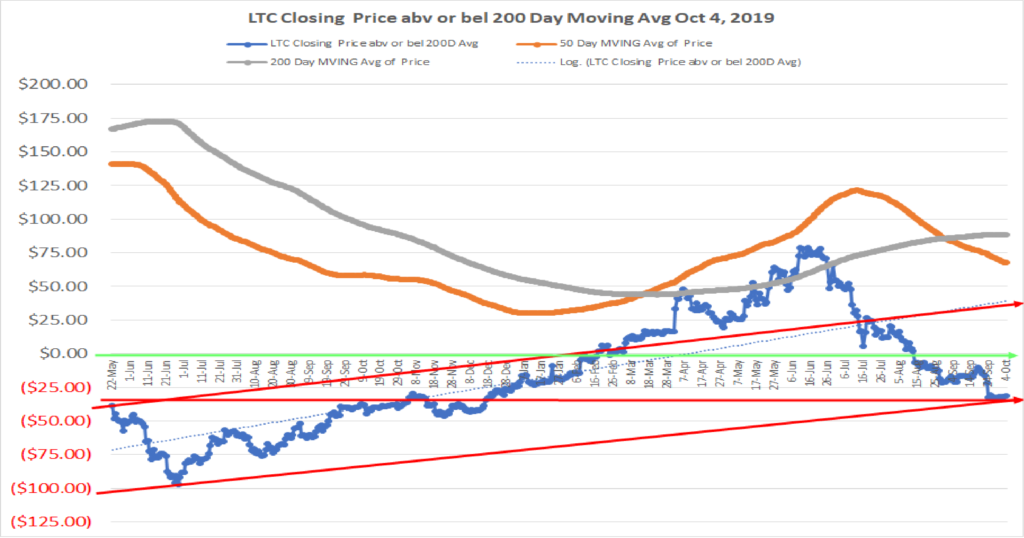
The 200-Day Moving Average vs the Current Price for Bitcoin, Ether, and LiteCoin reveal we are at a point of inflection where we should either see a price advance of material significance over a long-duration or a rejection and a fall in prices to form a new lower base.
Bitcoin

Ether

LiteCoin

You be the judge, but the BTC price and other charts below are all at or crossing over points that indicate price strengthening and a continued rise in price if the longer-term downward trends are truly broken to the upside:
The 10-day average price and volume has turned up; The 200-day MVA and 50-day MVA are at a point where the 50-day will turn up while the 200-day is still declining; The BTC Current price is above the 50-day MVA; BTC Daily Highs and Lows in price has turned up; and the chart of changes in upper and lower price bands has also turned up.
Keep a close watch as to how these resolve themselves. It does look like the easier path is toward higher prices and higher volumes.


Mixing analyses of equities and Crypto-Assets is quite interesting. One has tremendous government support and stimulus. The other has suspicion and fear by governments, with little to no support. Investing in one or both is a difficult decision, as one represents a consistent positive skew, while the other is volatile and in search of demand from strong use cases. What does the lack of company strength in terms of cash flow mean to you in this unusual investment climate for equities vs the unknown and risk of crypto?

Ether daily highs and lows in price shows pricing consolidation. At some point, demand of the Ethereum Network should begin to be reflected in unit pricing as contracts and DeFi become more pervasive.

The growth in Open Interest of Bitcoin Futures should not be ignored. The market has expansion potential, and I look to this as an additional avenue of information as to what is going on under the surface.
Volume concerns me. With the growth in Bitcoin wallets one would assume that volume would grow. The data does not confirm this expectation. What, if anything, will ignite greater adoption and desire to own Bitcoin?

Bitcoin 10-day Average Price and Volume show very low trading volume in a downward price channel. Is it time for a change? Watch the volume.

Bitcoin Daily Price Highs and Lows reveal a knocking on the door for a a breakout

Low price volatility of #BTC #ETH and #LTC often precedes a significant move in the near-term.

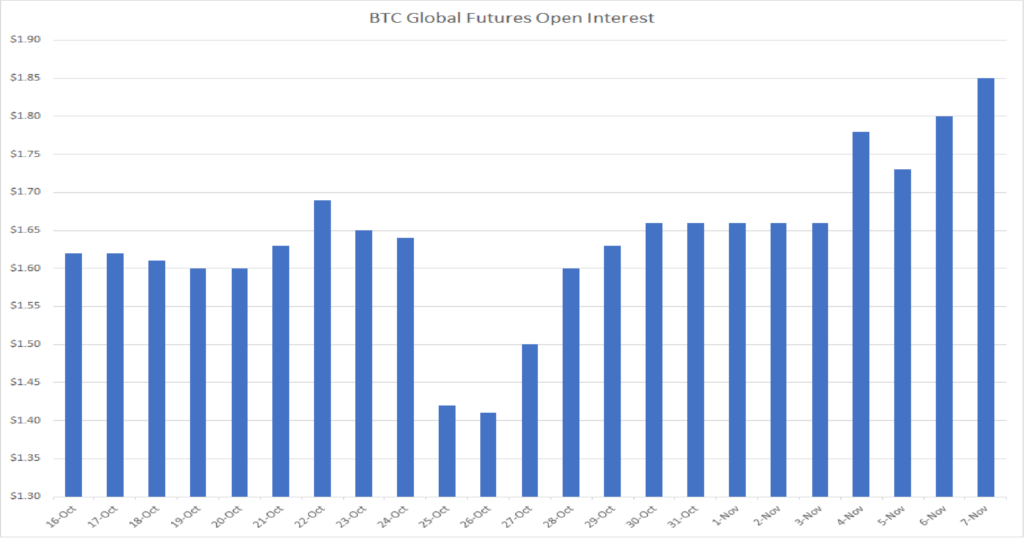
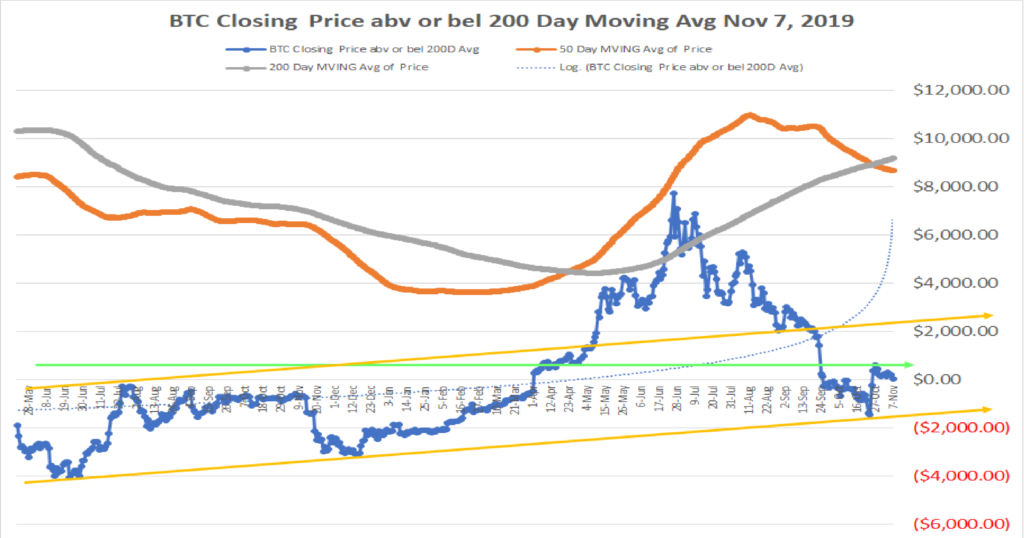
Global Bitcoin Futures: Nov 7, 2019 Open Interest in billions of U.S. dollars
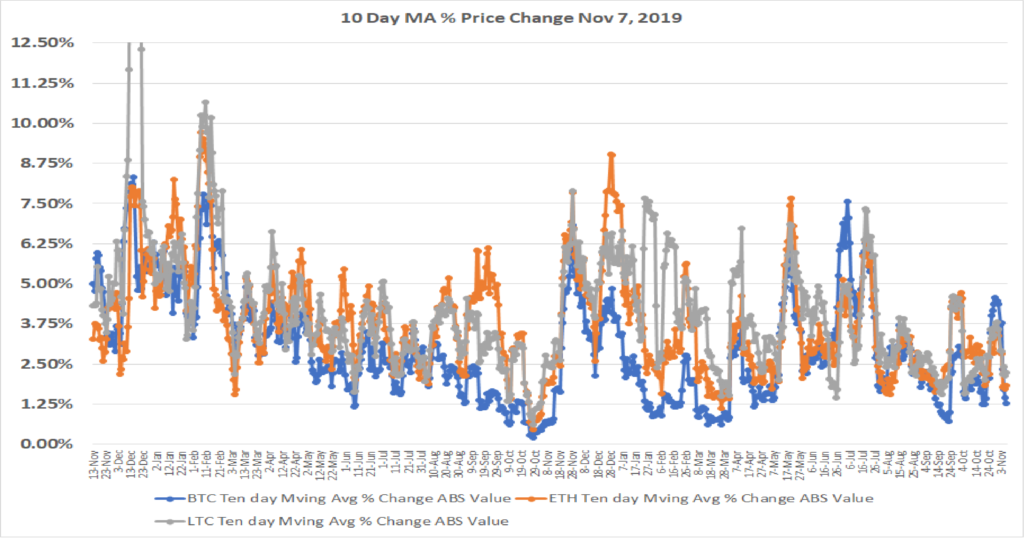
Volatility as of November 7, 2019
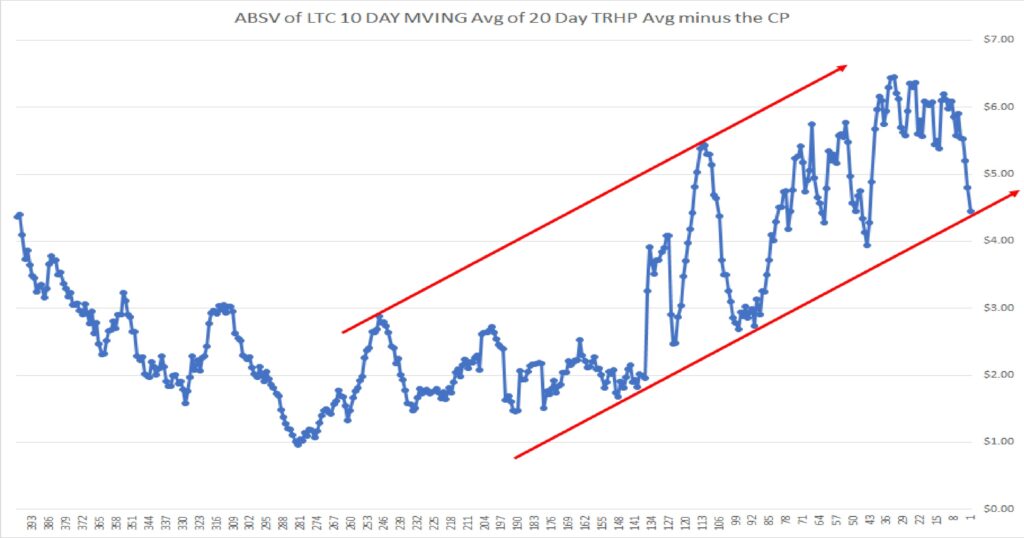
This chart shows the % change in BTC, ETH and LTC prices on an Absolute Value basis. The average daily change over ten days forms each data point for each cryptocurrency.
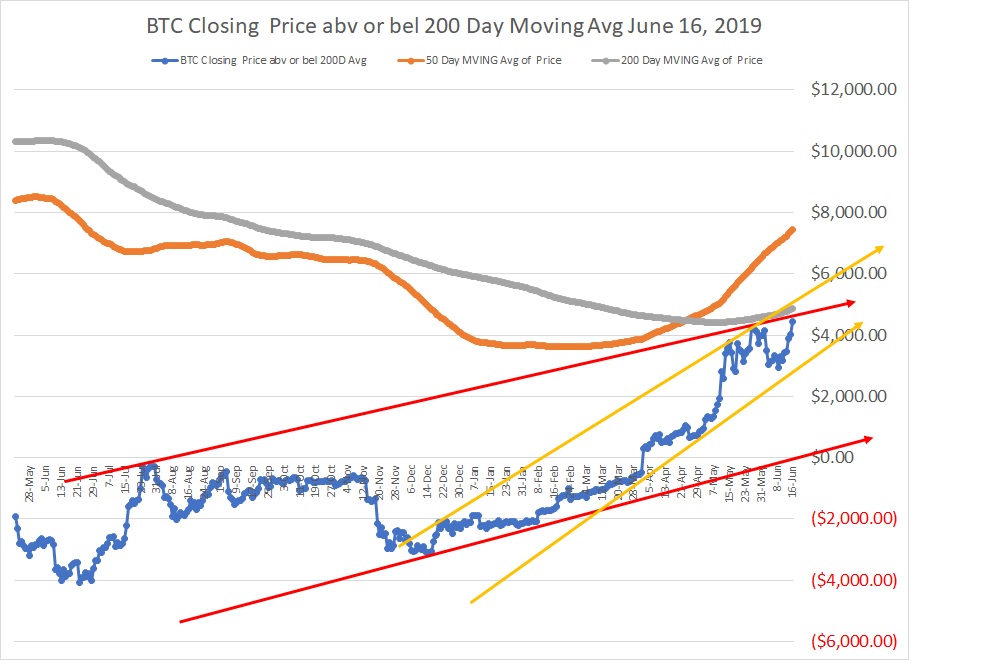
BTC 200 vs 50 Day moving avg price, plus the current price above or below 200 day MVA
BTC Ten day average of daily price and daily volume as of November 7, 2019

BTC Daily Volume
This chart shows the daily volume of BTC traded on Coinbase. Extreme volume days correspond with large price moves.

Bitcoin Daily Volume: Note the Sept. 24, 2019 volume was above trend, but not as high as prior sell-offs

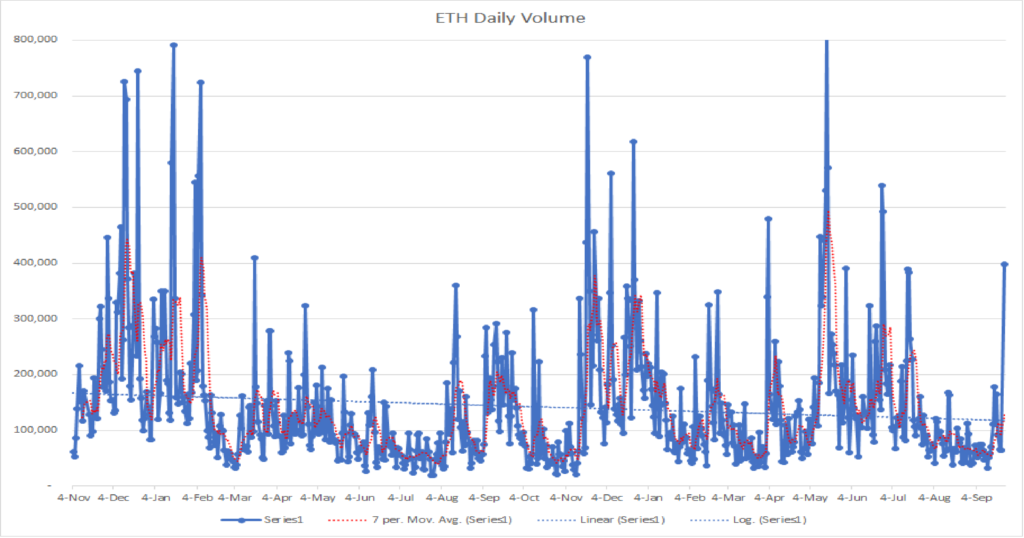
ETH Daily Volume
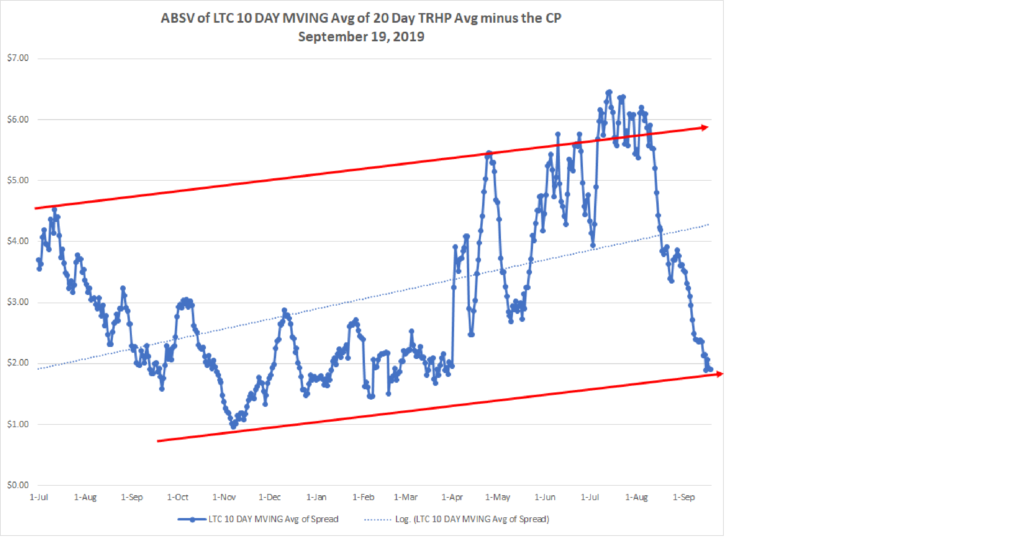
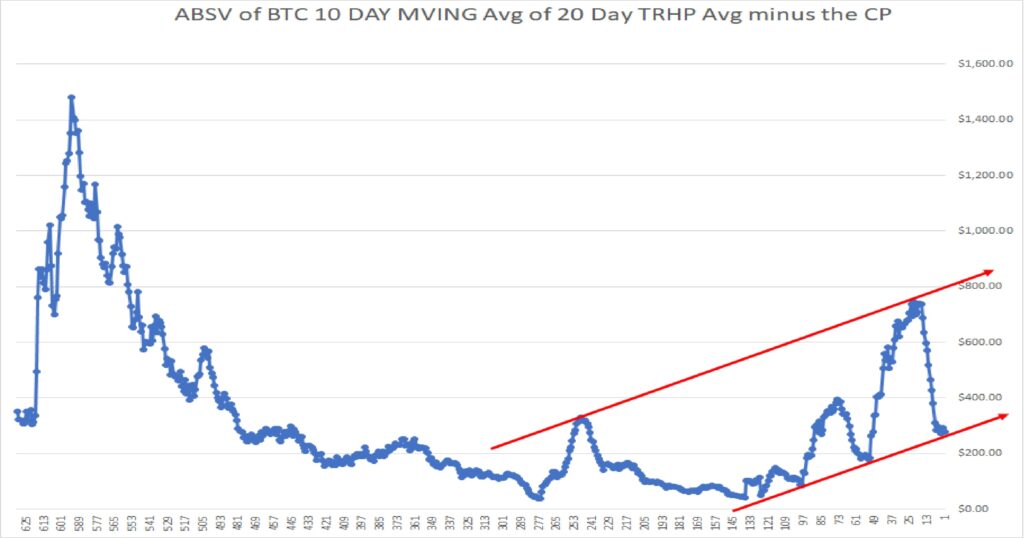
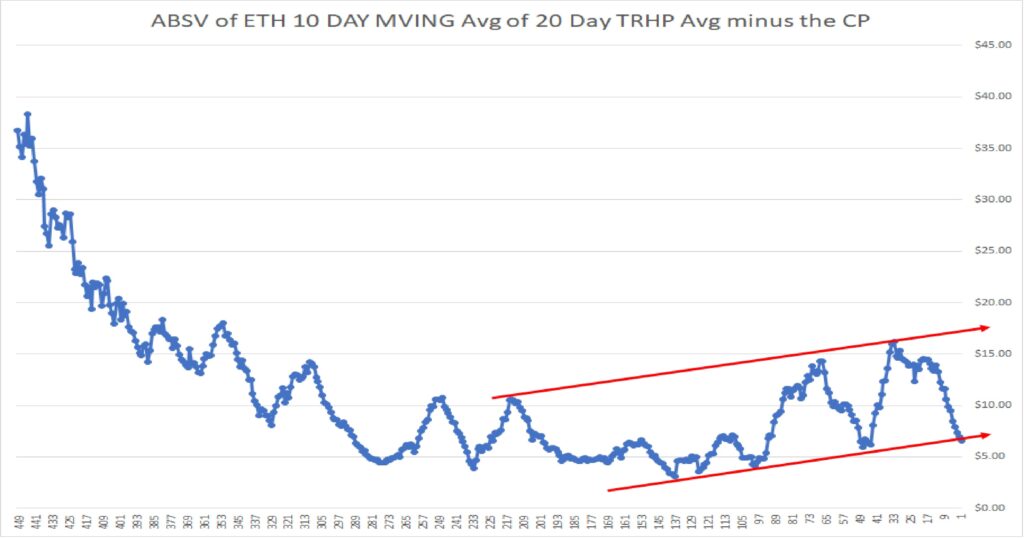
BTC Current Price spread away from the Absolute True High Price of BTC

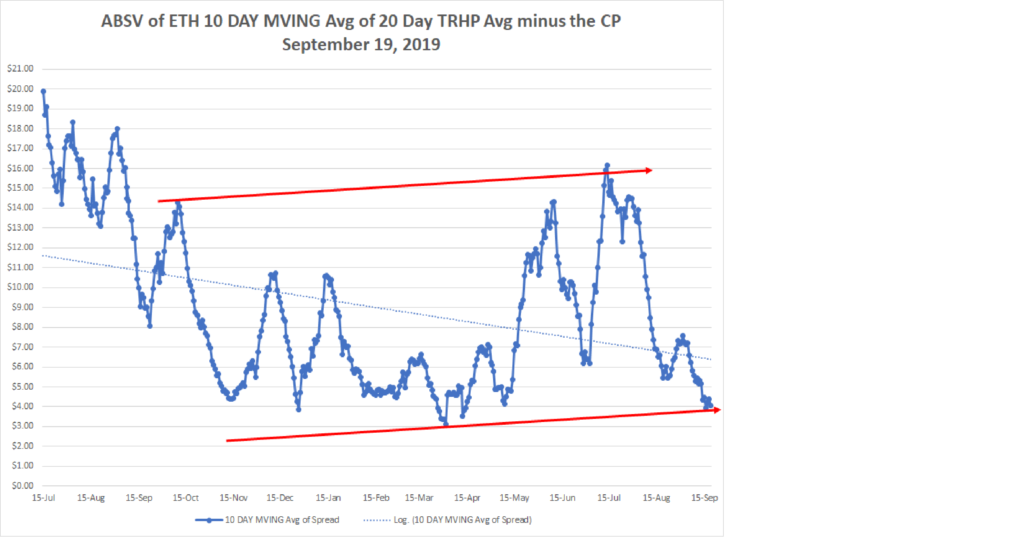
Charts as of September 19, 2019
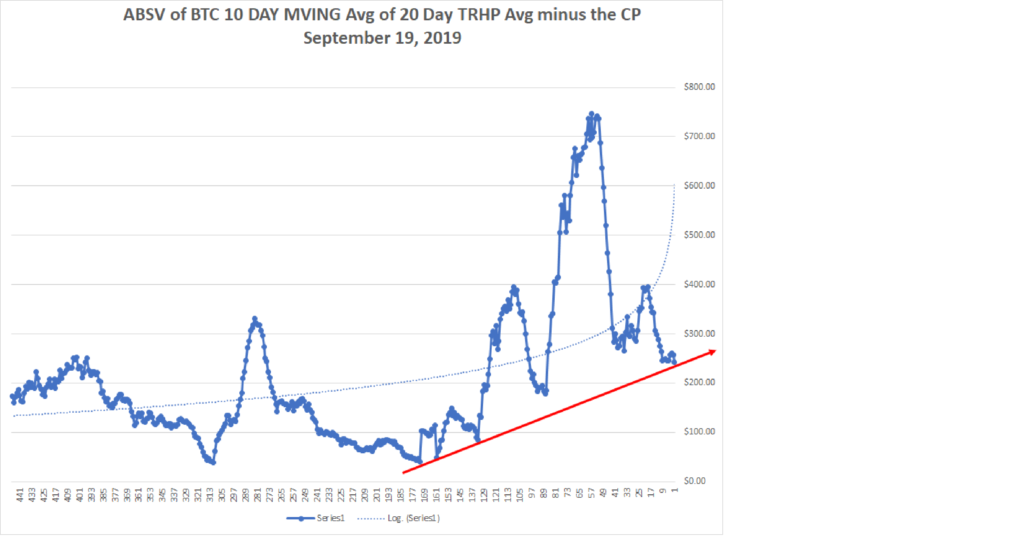
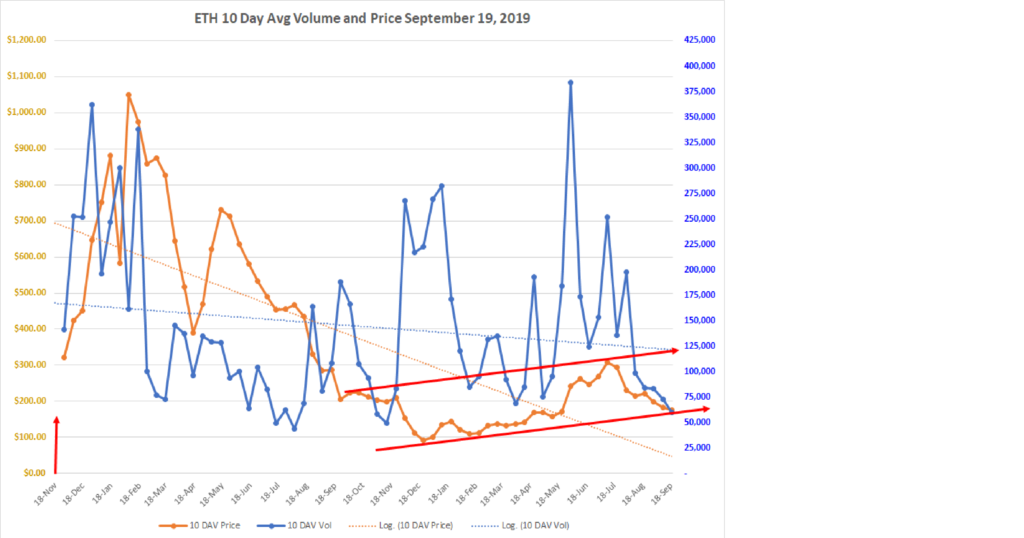
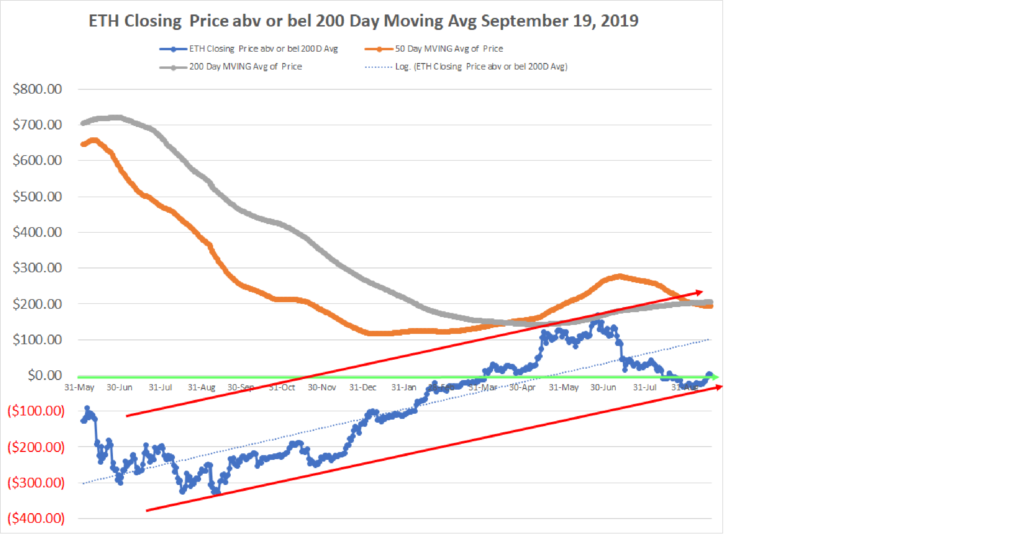
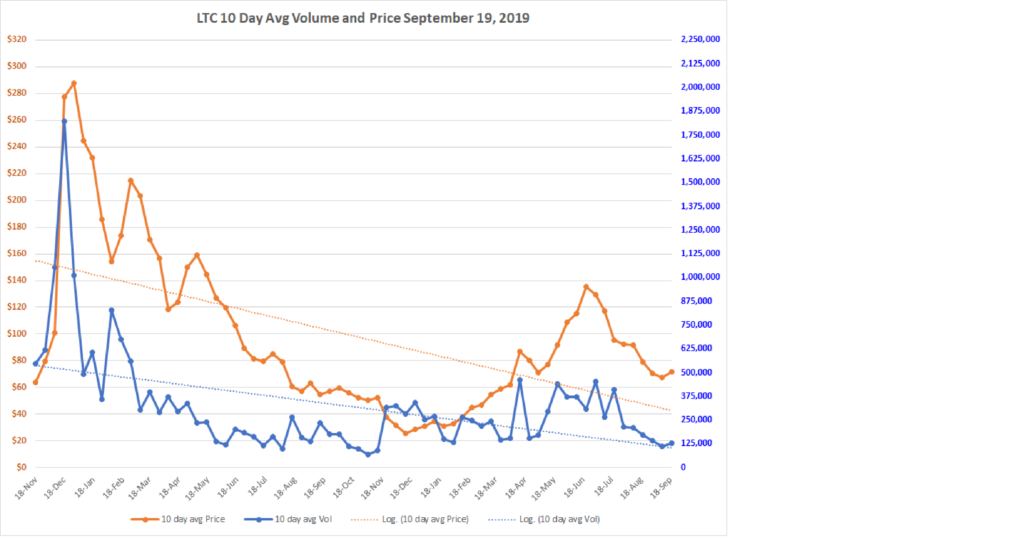
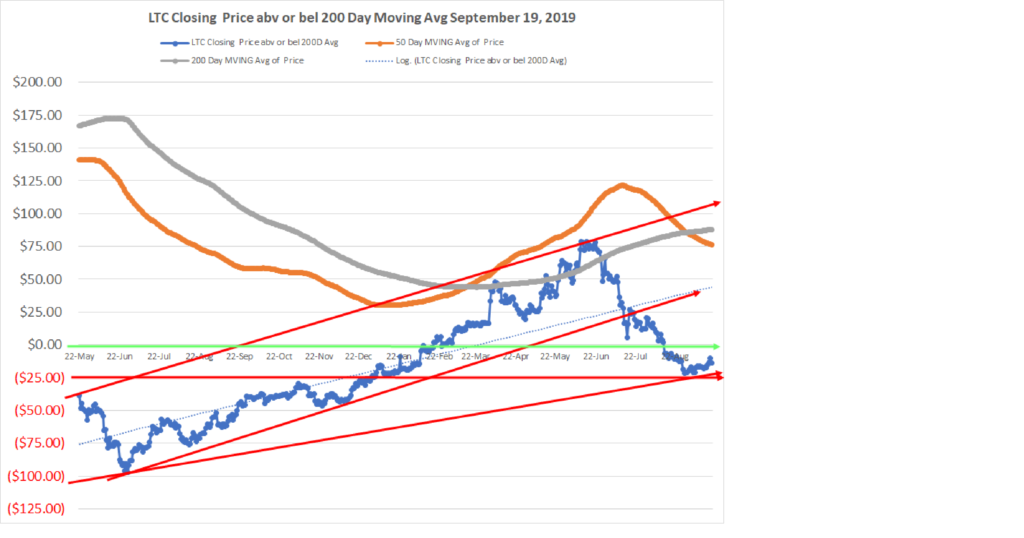
All three, BTC, ETH and LTC, are at the bottom of their uptrend lines.
The volume on the way down to these points has been low,with the 30 day avg volume for each below the 60 day and three year average volumes. Selling has been persistent but on low volume which points to a lack of buyers not any market trend change. Keep a close eye on both price and volume for each to assess whether we will see a meaningful upturn with increased volume as the prices move higher or a continued decline with increasing momentum in volume (sell signal)
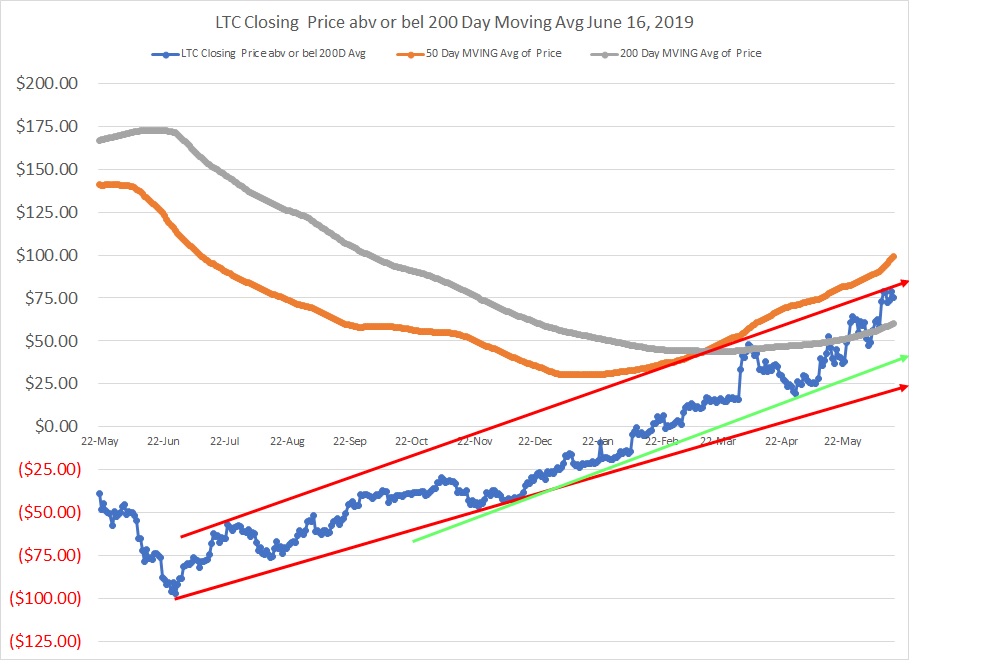
The recent demand for BTC, ETH and LTC are showing some deteriorating technical factors. June 16, 2019
My significant concern with BTC and ETH begins with volume. The 30-day and 60-day average volumes for BTC and ETH are above their long-term averages. This is a positive and supportive of the demand curve pushing the prices higher. My concern is that the 30-day average volumes have now both fallen below the 60-day averages. This indicates to me that there is an element of exhaustion coming into play. Further, with BTC, it is at the top of its 200-day moving average price channel (see chart below where the blue line is touching the upper red line).
Ethereum is some distance away from the top of its channel, showing there may still be a move to the $290 to $300 level before turning back.
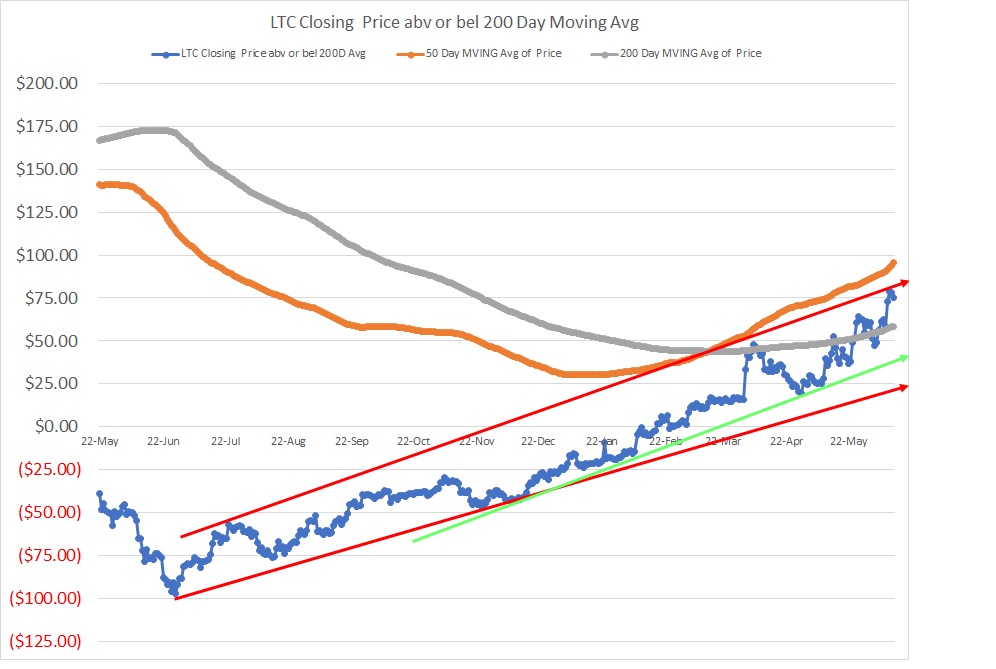
As to LTC, it is also at the top of its channel, and poses the same sense of caution I see with BTC (see chart below).
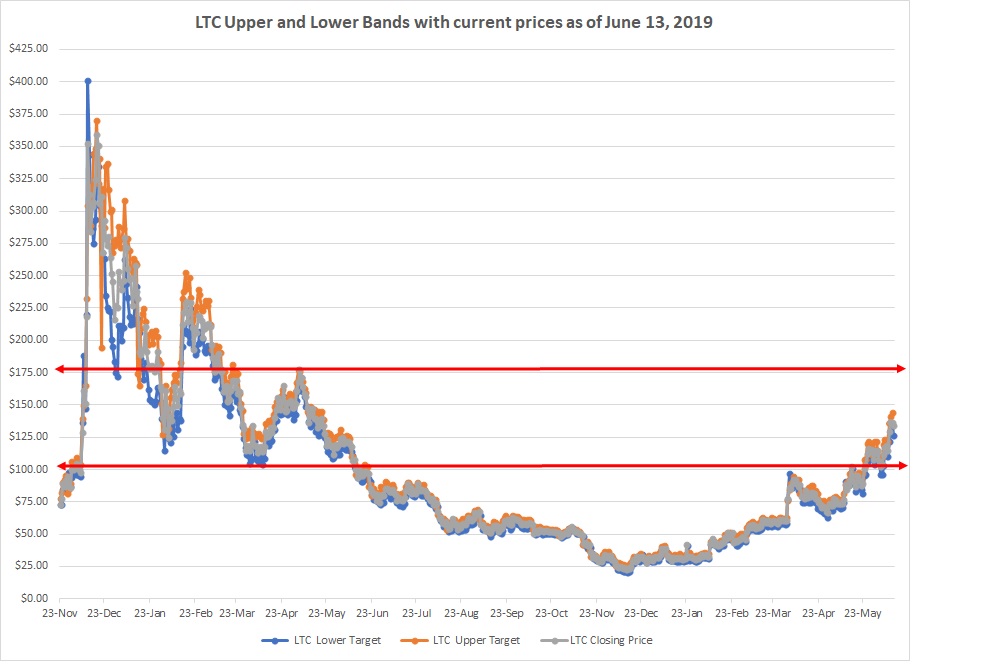
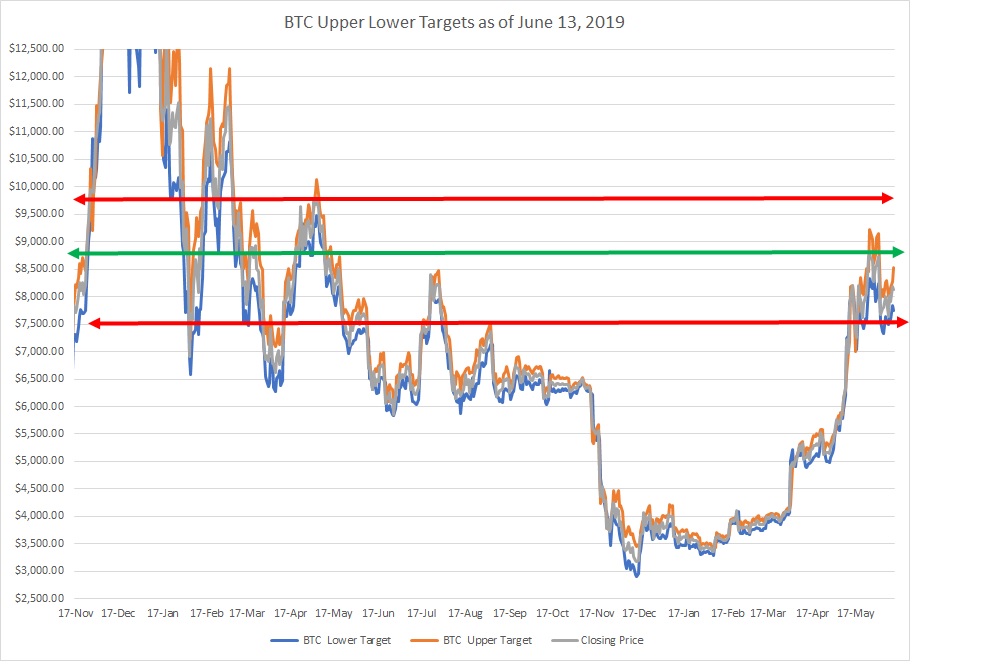
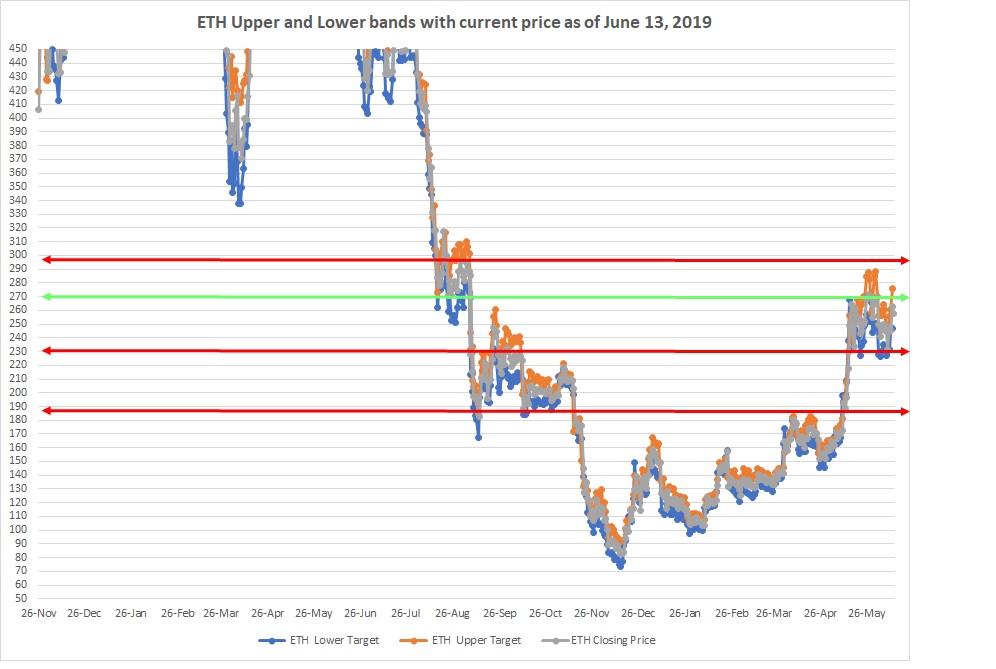
The recent price movements for BTC, ETH and LTC provide some interesting technical clues of where future prices may head. June 13, 2019
LTC once again has led the price move higher. It has been the leading indicator for Crypto-currencies for all of 2019. Presently, it sits at a point of resistance and I believe needs to pause, maybe pull back some, before continuing on its advance. In this waiting period, BTC and ETH are likely to follow-through on the recent price strength of LTC, and advance during this period of LTC fatigue. In the two charts below you will see the climb and point of resistance for LTC. In the following charts you will see the next higher confirmation points for BTC and ETH which will serve as validation, if exceeded, of a continued pattern of Crypto-currency strength in the current market.
On the 200-day moving average chart for Litecoin, you can see we are at the top of the channel, a time to pause in the advance toward the next point of resistance at $175.
Bitcoin needs to break the resistance at $8,660 to open the path toward its a prior cycle high at $9,800. I do expect this to happen between now and the end of August 2019.
Ethereum has significant resistance at the $270 closing price level. It has been consolidating between $240 and $270 for some time, and a break higher on a daily close above $270 should open the door to an advance to $300 to $340.
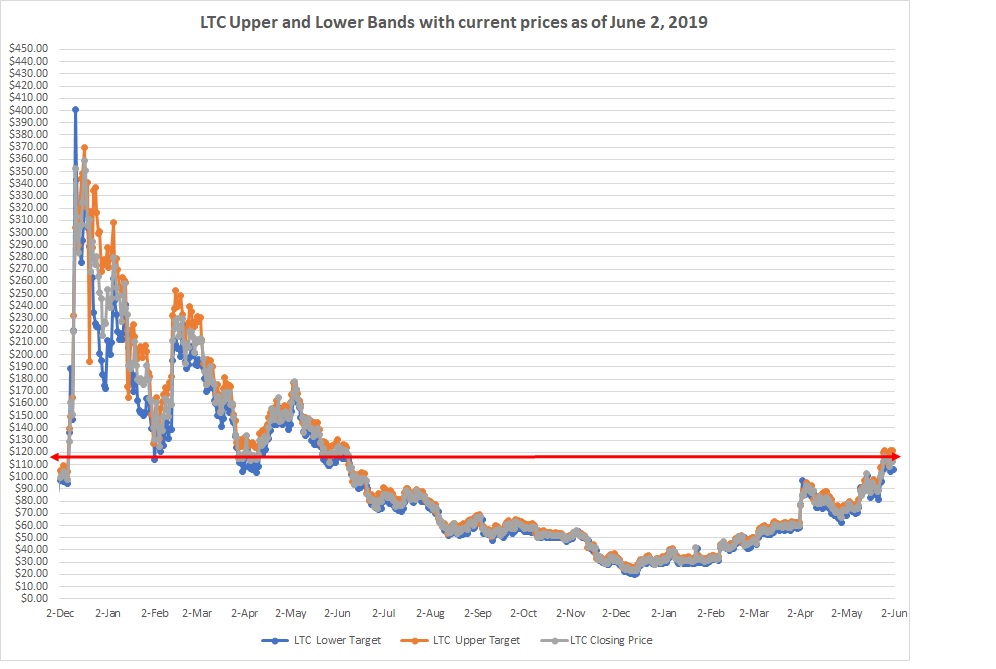
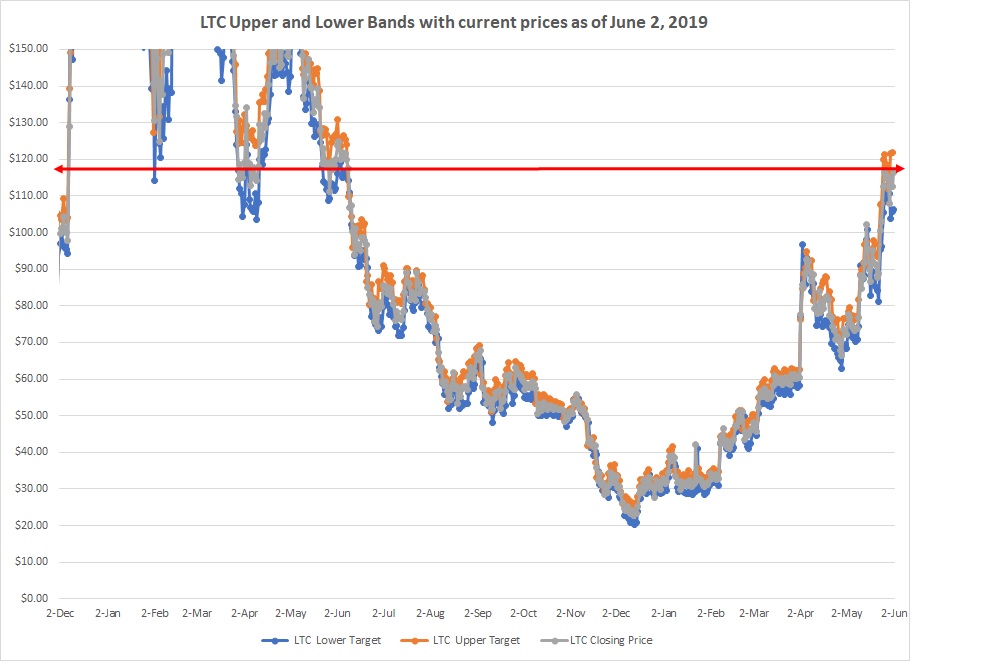
LiteCoin Higher Highs and Higher Lows, June 2, 2019
Here are two charts on the price of LiteCoin. The upper chart is the daily closing price set between the Daily 20-day Absolute True Range (“ATR”) of highs and the ATR of Lows. This covers the period Dec 2017 to June 2019. The lower chart is the same except that I have narrowed the price range to between $0 and $150 to give a magnified view of recent price action. As you can see, we are experiencing higher highs and higher lows. From a technical perspective, this is bullish for future price increases. Having said this, you should also note that we are bumping up against a ceiling that was double set in 2018 (see the two lows and bounces higher off of them in early April and early June of 2018, before finally breaking below them in mid-June 2018). If LTC can pierce this ceiling of resistance, it will likely move much higher to the next resistance point of $177.
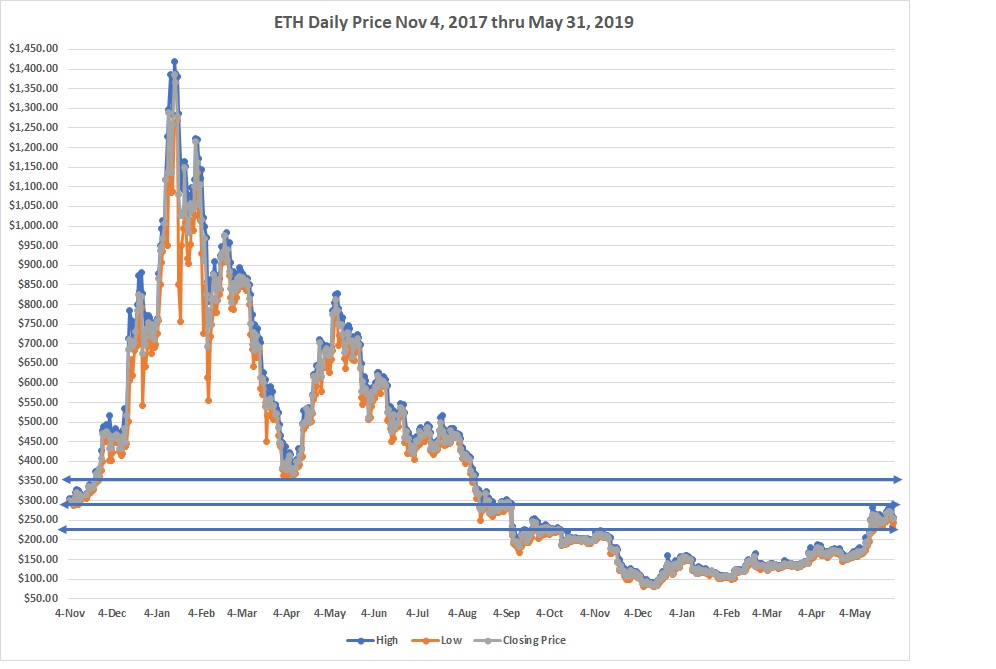
Ether Higher Highs and Higher Lows, May 31, 2019
Here are two charts on the price of Ethereum. The upper chart is the daily closing price set between the daily high and low price. This covers the period Nov 2017 to May 2019. The lower chart is the same except that I have narrowed the price range to between $50 and $350 to give a magnified view of recent price action. As you can see, we are experiencing higher highs and higher lows. From a technical perspective, this is bullish for future price increases.

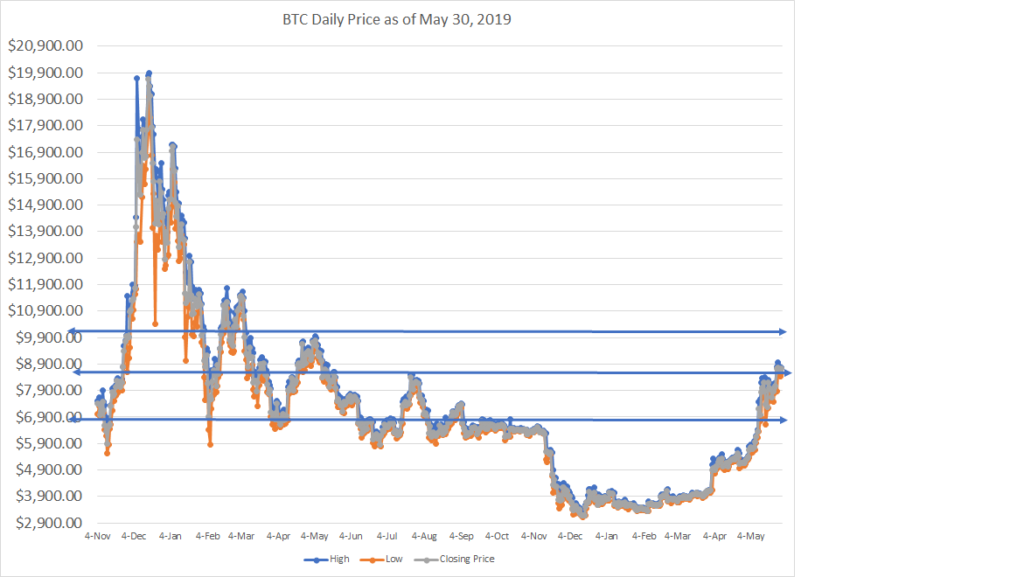
Bitcoin’s area of support
The chart below shows the absolute true value avg for 20 days of the daily highs and lows of the price of BTC. Today’s pull back from the quick and rapid rise to $9,000 may settle at the point of support from July 2018 of $8,472, or test the prior high of $8,203 from 16 days ago. An overshoot to the downside is not out of the question as the current futures contracts expire tomorrow which adds significant volatility. A break below $8,100 and I will be adding to my position.

The price of Bitcoin from November 2017 through May 30, 2019 is below. The next point of resistance to the upside is $9,800
Loom Network and Blockchain based Games as a seamless entry point for mass adoption by consumers
This article was written in September 2018. It is a great articulation of the issues and hurdles that slow/prevent mass consumer interaction with Blockchain based solutions and the approach LOOM is pursuing to remove those hurdles. If you want to be educated by an easy to read non-technical article about Blockchain possibilities, LOOM’s approach, and the potential of DApps on the Ethereum network, then this is a great place to start.
https://medium.com/loom-network/games-will-be-the-catalyst-for-blockchain-mass-adoption-628f818c6c87
The Binance response to being Hacked and having $40 million of Bitcoin taken
Binance’s centralized exchange was hacked roughly two weeks ago. The source of the hackers access points to a number of account holders who are registered on the BNB exchange. These individuals were either careless with passwords, authenticator codes, and API keys, or were targeted by Phishing attacks and provided their access information to the criminals who perpetrated the hack. The conduct of the executive team and the entire team of Binance is a lesson in excellence of commitment to getting control of a bad situation, transparency in communicating to their community in real-time as events unfolded, and taking action to protect the account holders who suffered from the Hack. My admiration for Binance only grows, and after opening the link below you will better understand why this is so.
https://www.binance.com/en/blog/336904059293999104/Security-Incident-Recap
Blockchain Goes To Work At Walmart, IBM, Amazon, JPMorgan, Cargill and 45 Other Enterprises
https://www.forbes.com/sites/michaeldelcastillo/2019/04/16/blockchain-goes-to-work/#18aef7742a40
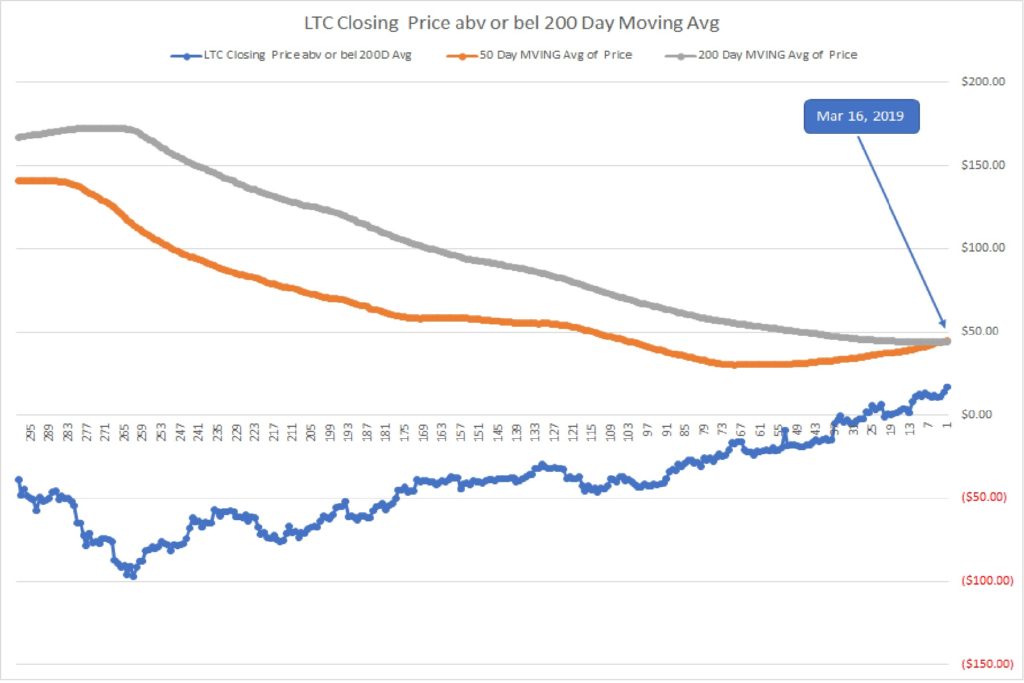
As of this morning, March 16, 2019,
the 50-Day Moving average of the price of LiteCoin has crossed over the 200-Day Moving Average
Couple this with the actual current price of LTC exceeding the 200-Day MVA by $16.59, the highest positive difference in more than a year, and the bullish case for LTC is becoming well established from a technical perspective.
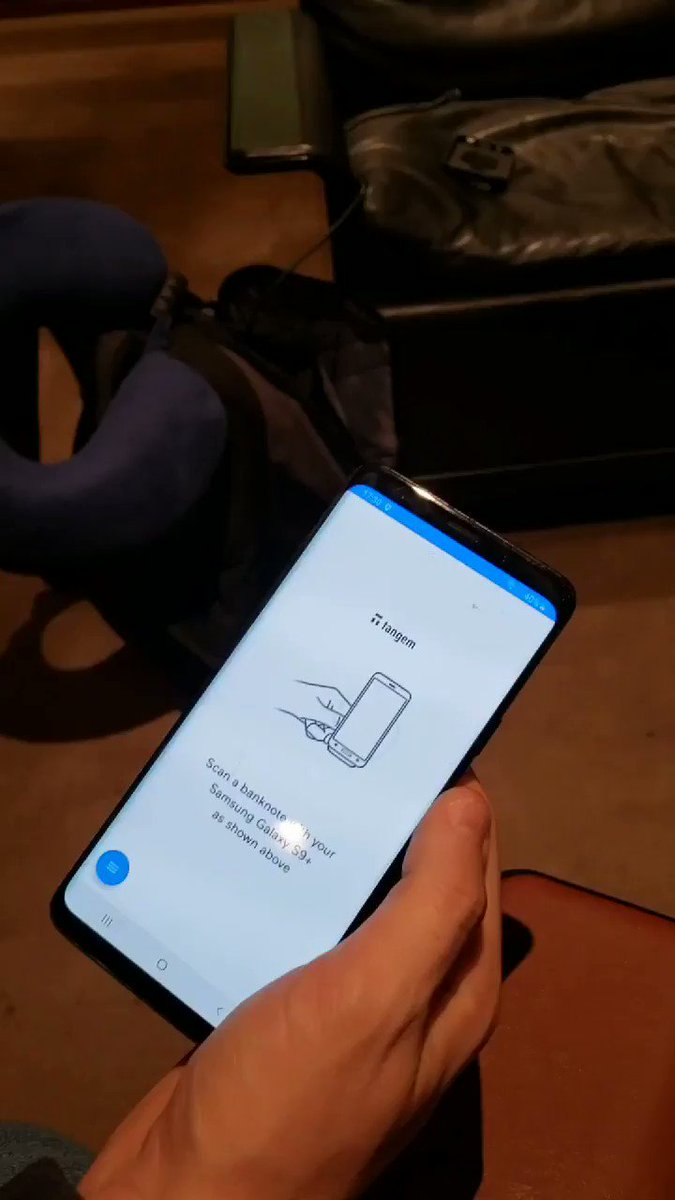
Samsung Pay Will Integrate Cryptocurrencies for 10 Million Users: Report Joseph Young 09/03/2019 Bitcoin Wallets, Crypto, News
https://www.ccn.com/samsung-pay-10m-users-integrate-crypto
Even before the official announcement of Samsung Electronics on the launch of the Samsung Blockchain Wallet, local publications speculated that Samsung Pay could be behind the high-profile crypto integration for the Galaxy S10.
IF SAMSUNG PAY IS BEHIND THE CRYPTO INTEGRATION, IT MAY BE CRUCIAL FOR REAL ADOPTION
On January 29, The Korea Herald reported that Samsung is set to integrate a cryptocurrency wallet into the Galaxy S10, well over a month before the formal release of the Samsung Blockchain Wallet on February 21.
Industry sources reportedly told the publication that Samsung Pay, a widely utilized digital payments application with over 10 million active users, is behind the Galaxy S10’s cryptocurrency wallet.
“The arrival of the new Samsung phones could start popularization of the cryptocurrency wallet system in Korea,” an industry executive said.

On March 8, three weeks following the release of the Samsung Blockchain Wallet, Donga, one of the largest mainstream media outlets in South Korea, reported that Samsung Pay considers cryptocurrency integration as a way to expand its user base internationally.
The report entitled “Crypto, Flying Away With Samsung Pay on its Back?,” which was featured in the March edition of Shin Donga, the oldest and most popular magazine in the country, said that cryptocurrency support will strengthen Samsung Pay as a fintech platform.
The report translated by CCN read:
Samsung Pay has recently extended the transaction period for overseas users and integrated an international payment processing service, aggressively targeting the global financial services market.
At this phase of development, if a cryptocurrency wallet is added to Samsung Pay, the application will be strengthened as a complete fintech platform. Currently, the Samsung Blockchain Wallet is said to be supporting Ethereum but more cryptocurrencies are expected to be integrated in the near-term.
Samsung Pay’s consideration of integrating cryptocurrencies goes in line with its past acquisitions and product launches.
Since its inception, Samsung Pay has competed headfirst against other digital payments applications like Apple Pay and KakaoPay in innovation and technological development.
In 2015, Samsung Pay acquired LoopPay for $250 million, an acquisition that had seen mixed reactions from industry analysts.
The acquisition allowed Samsung Pay users to process payments by hovering the phone over point of sale (PoS) terminals, providing the platform an edge over its competitors in user experience.
According to Donga, the user base of Samsung Pay has grown by 58 percent from 2017 to 2018, by a staggering 6.6 million users.

Samsung Pay Surpasses Instagram in South Korea |Source: Wiseapp.co.kr
Given the well-documented and successful strategy of Samsung to pursue aggressive acquisitions, product launches, and the integration of newly emerging technologies, many analysts in South Korea expect Samsung Pay to take a lead in the cryptocurrency sector.
WIN-WIN FOR CRYPTO AND FOR SAMSUNG
Similar to the integration of Bitcoin by Square Cash, Samsung Pay could benefit from cryptocurrency integration and appeal to millennial and digital asset users.
Since Square integrated Bitcoin in late 2017, the market valuation of the company has increased by 516 percent, evolving into a payments behemoth.
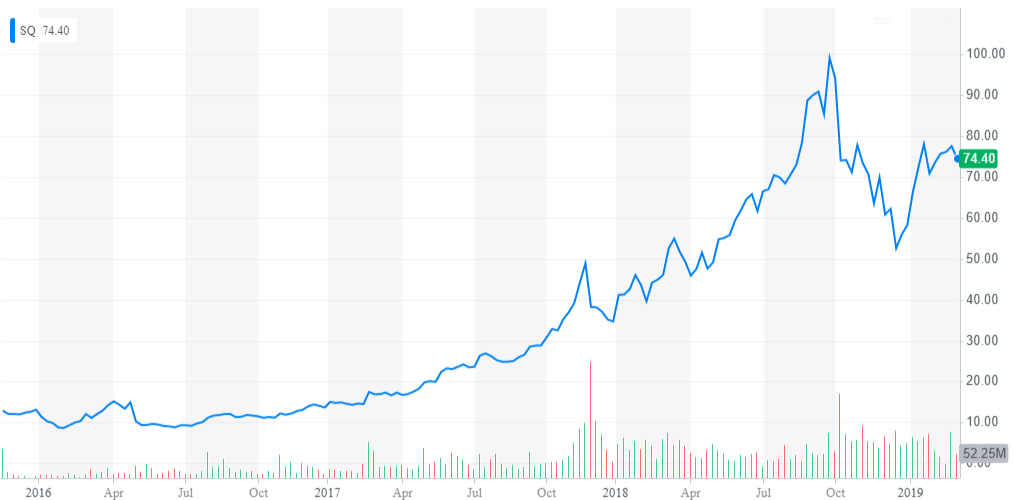
5-Year Chart of Square | Source: Yahoo Finance
Bitcoin most likely has not been a core catalyst in the growth of Square but it has played a vital role in establishing an initial user base for Square and enabled the company to snowball in the months ahead.
As of April 2018, Samsung Pay recorded $18 billion in transaction volume and industry experts believe the integration of crypto by Samsung Pay could fuel the mainstream adoption of cryptocurrencies, especially on the side of merchants.
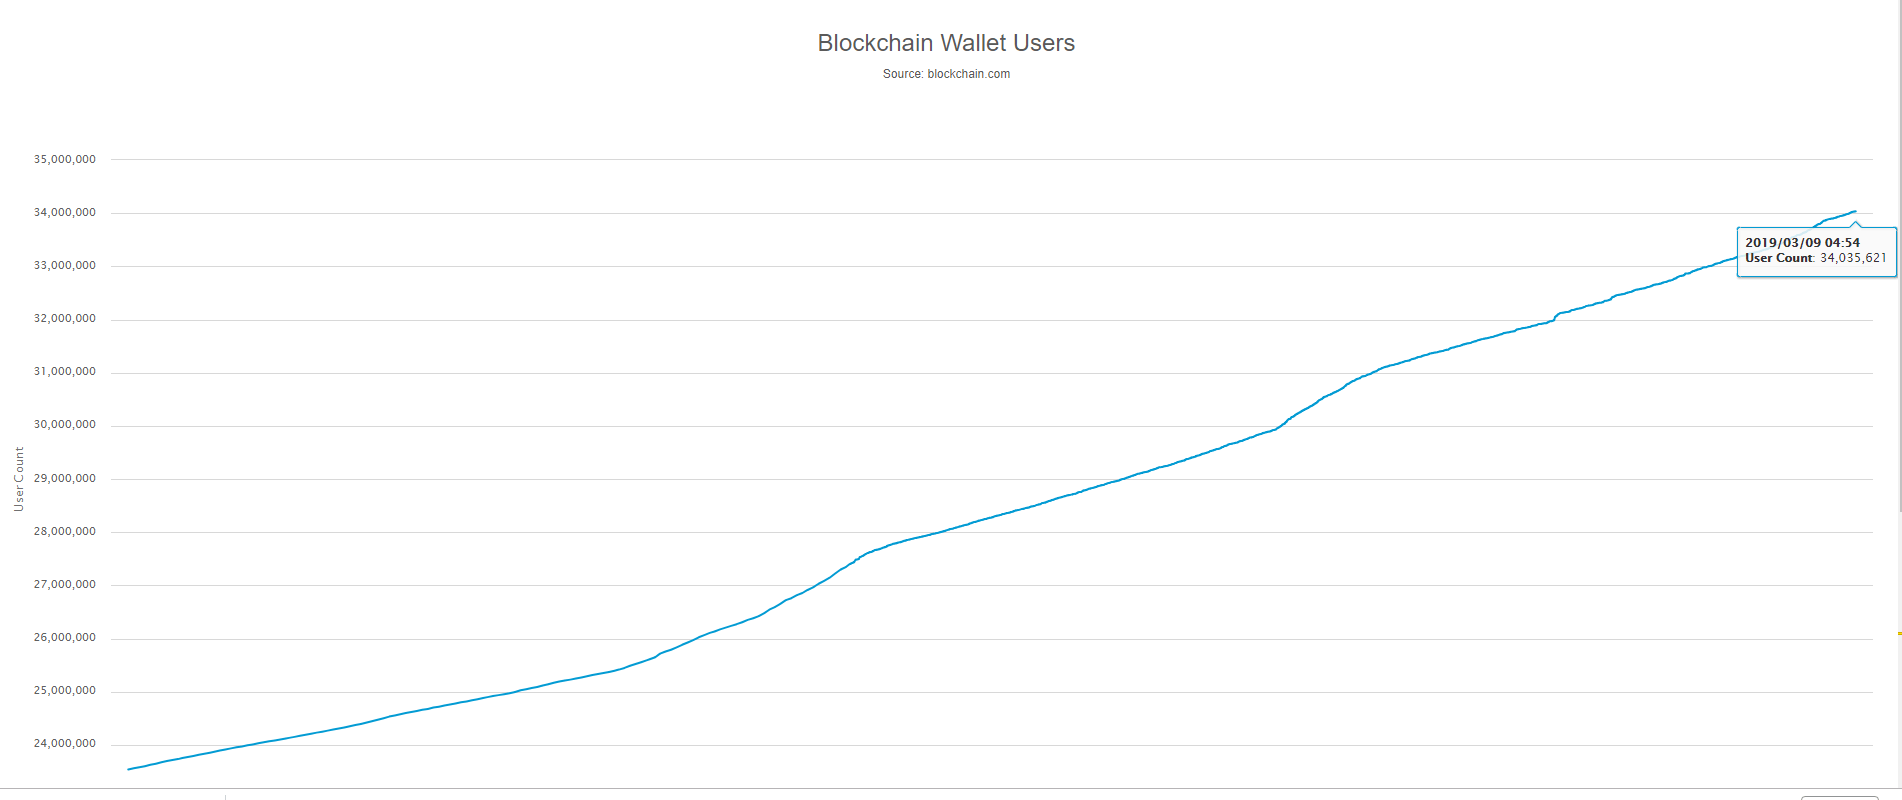
Growth of Cryptocurrency Wallets on Blockchain | Source: Blockchain.com
ENJIN enters into partnership with Samsung
https://www.asiacryptotoday.com/confirmed-samsung-and-enjin-to-partner-on-s10/
Samsung, the smartphone giant have confirmed rumors of a partnership with Enjin, the crypto wallet/gaming platform, as they join forces for the blockchain gaming portion of the phone.
It has been reported that ‘Enjin Coin’ is Cooperating with Samsung for games and services, provided through the Samsung Galaxy Store. Previously Asia Crypto Today exclusively revealed the rumor of a potential partnership, with Enjin being used for the sending and receiving of ERC-20 tokens and ERC-1155 crypto game assets after gaining information from sources and Enjin’s interface appeared on the screen introducing the key money store ‘key store’ in the spot where Samsung Electronics unveiled the Galaxy S10 for the first time last month.
The partnership with Samsung for the gaming feature clearly makes sense. Enjin is one of the industry leaders in terms of blockchain based gaming. The Enjin team created the ERC-1155 asset class on the Ethereum blockchain, a token class used for in-game goods and digital item ownership. The ERC 1155 and ERC 721 have also taken the world by storm last year, introducing the world to non-fungible tokens such as crypto kitties.
Furthermore, the Singaporean based company started the Enjin platform early support program from last August to January this year. It is a program that supports technology and marketing for new blockchain game and service development. More than 1000 projects were supported by this program, and Enjin Coin selected 40 of these projects to take on the platform, some of which will no doubt be on the S10.
Argentina: Government to Co-Invest in Local Blockchain Projects Backed by Binance
https://cointelegraph.com/news/argentina-government-to-co-invest-in-local-blockchain-projects-backed-by-binance
The government of Argentina has agreed to co-invest in blockchain projects that are backed by Binance Labs and Latin American crypto exchange LatamEx, a press release shared with Cointelegraph on Wednesday, March 6, reveals.
Binance Labs, the investment and social impact arm of top cryptocurrency exchange Binance, has recently chosen Argentina’s capital, Buenos Aires, as the Latin American hub for the next season of the Binance Labs Incubation Program.
Following the decision, the country’s Ministry of Production and Labour has signed an agreement with Binance, committing to match investments of up to $50,000 in each project. According to the release, the Argentine government will fund up to 10 blockchain projects each year over a four-year term.
Investments will be funneled through Founders Lab, an Argentine blockchain accelerator.
Buenos Aires is one of the six locations of Binance Labs’ investment program, which kicks off on March 25. Other regional chapters are located in San Francisco, Berlin, Lagos, Singapore and Hong Kong.
In other crypto news from Argentina, earlier this month, the country’s official state transport card SUBE (Sistema Único de Boleto Electrónico) — used by over seven million people in 37 locations — started accepting Bitcoin (BTC).
Last month, Argentina also settled an agricultural chemicals export deal worth $7,100 with Paraguay, accepting the payment in BTC.
In January, United States University of California, Berkeley launched a 12-week accelerator program for early stage blockchain startups, partly sponsored by venture capital fund Berkeley X-Lab Fund.
IBM, along with Columbia University, also run two blockchain accelerator programs that aim to help startups in the crypto space. The programs form the Columbia-IBM Center for Blockchain and Data Transparency, a joint innovation center that was established by the tech giant and the Ivy League school in the summer of 2018.
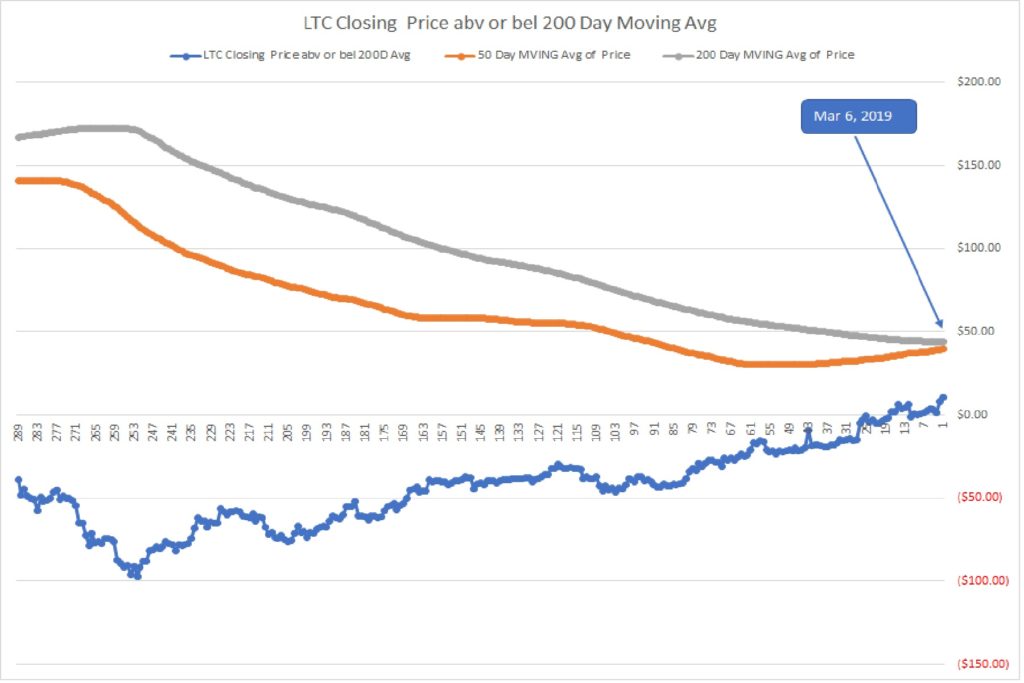
The March 6, 2019 updated LiteCoin chart of the 50 day and 200 day moving average continues to exhibit bullish movement toward a cross-over. The Current price is already above the 200 day MVA. Pay attention
JP Morgan introduces their own Crypto-Currency Coin
JP Morgan is rolling out the first US bank-backed cryptocurrency to transform payments business
- Engineers at the lender have created the “JPM Coin,” a digital token that will be used to instantly settle transactions between clients of its wholesale payments business.
- Only a tiny fraction of payments will initially be transmitted using the cryptocurrency, but the trial represents the first real-world use of a digital coin by a major U.S. bank.
- While J.P. Morgan’s Jamie Dimon has bashed bitcoin as a “fraud,” the bank chief and his managers have consistently said blockchain and regulated digital currencies held promise.
Published 5 Hours Ago Updated 2 Hours AgoCNBC.com
The first cryptocurrency created by a major U.S. bank is here — and it’s from J.P. Morgan Chase.
The lender moves more than $6 trillion around the world every day for corporations in its massive wholesale payments business. In trials set to start in a few months, a tiny fraction of that will happen over something called “JPM Coin,” the digital token created by engineers at the New York-based bank to instantly settle payments between clients.
J.P. Morgan is preparing for a future in which parts of the essential underpinning of global capitalism, from cross-border payments to corporate debt issuance, move to the blockchain. That’s the database technology made famous by its first application, bitcoin. But in order for that future to happen, the bank needed a way to transfer money at the dizzying speed that those smart contracts closed, rather than relying on old technology like wire transfers.
“So anything that currently exists in the world, as that moves onto the blockchain, this would be the payment leg for that transaction,” said Umar Farooq, head of J.P. Morgan’s blockchain projects. “The applications are frankly quite endless; anything where you have a distributed ledger which involves corporations or institutions can use this.”
For some, J.P. Morgan’s new currency may come as an unexpected development for a technology that rose from the wreckage of the financial crisis and was supposed to disrupt the established banking world.
When the international payments are tested, it will be one of the first real-world applications for a cryptocurrency in banking. The industry has mostly shunned the asset class as too risky. Last year, J.P. Morgan and two other lenders banned the purchase of bitcoins by credit card customers. And Goldman Sachs reportedly shelved plans to create a bitcoin trading desk after exploring the idea.
Dimon bashed bitcoin
Though holders of digital currencies may seize on the news that a major financial institution is issuing its own crypto as bullish for the asset class, retail investors will probably never get to own a JPM Coin. Unlike bitcoin, only big institutional clients of J.P. Morgan that have undergone regulatory checks, like corporations, banks and broker-dealers can use the tokens.
There are other key differences between the bank’s crypto and bitcoin, which J.P. Morgan CEO Jamie Dimon has bashed as a fraudthat won’t end well for its investors. (To be clear, he and his managers have consistently said that blockchain, as well as digital currencies that were regulated, hold promise.)
Each JPM Coin is redeemable for a single U.S. dollar, so its value shouldn’t fluctuate, similar in concept to so-called stablecoins. Clients will be issued the coins after depositing dollars at the bank; after using the tokens for a payment or security purchase on the blockchain, the bank destroys the coins and gives clients back a commensurate number of dollars.
Real-time settlement
There are three early applications for the JPM Coin, according to Farooq.
The first is for international payments for large corporate clients, which now typically happens using wire transfers between financial institutions on decades-old networks like Swift. Instead of sometimes taking more than a day to settle because institutions have cut-off times for transactions and countries operate on different systems, the payments will settle in real time, and at any time of day, he said.
The second is for securities transactions. In April, J.P. Morgan tested a debt issuance on the blockchain, creating a virtual simulation of a $150 million certificate of deposit for a Canadian bank. Rather than relying on wires to buy the issuance — resulting in a time gap between settling the transaction and being paid for it — institutional investors can use the J.P. Morgan token, resulting in instant settlements.
The final use would be for huge corporations that use J.P Morgan’s treasury services business to replace the dollars they hold in subsidiaries across the world. Unseen by retail customers, the business handles a significant chunk of the world’s regulated money flows for companies from Honeywell International to Facebook, moving dollars for activities like employee and supplier payments. It generated $9 billion in revenue last year for the bank.
“Money sloshes back and forth all over the world in a large enterprise,” Farooq said. “Is there a way to ensure that a subsidiary can represent cash on the balance sheet without having to actually wire it to the unit? That way, they can consolidate their money and probably get better rates for it.”
Looking further out, the JPM Coin could be used for payments on internet-connected devices if that use for blockchain catches on, Farooq said.
J.P Morgan is betting that its first-mover status and large market share in corporate payments — it banks 80 percent of the companies in the Fortune 500 — will give its technology a good chance of getting adopted, even if other banks create their own coins.
“Pretty much every big corporation is our client, and most of the major banks in the world are, too,” Farooq said. “Even if this was limited to JPM clients at the institutional level, it shouldn’t hold us back.”
— With reporting by CNBC’s Kate Rooney
And the Counter-point
https://www.linkedin.com/pulse/case-against-bankcoin-brad-garlinghouse/
Forecast cash flow growth for 187 companies 2019
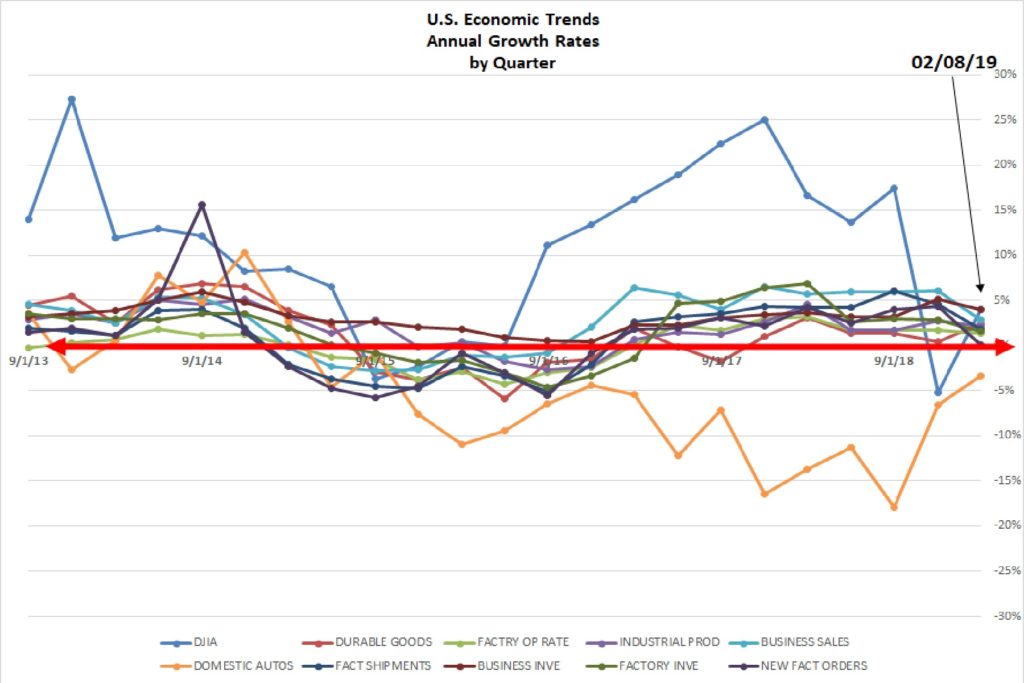
Annual Economic Growth by Quarter 2019
New Factory Orders 2019
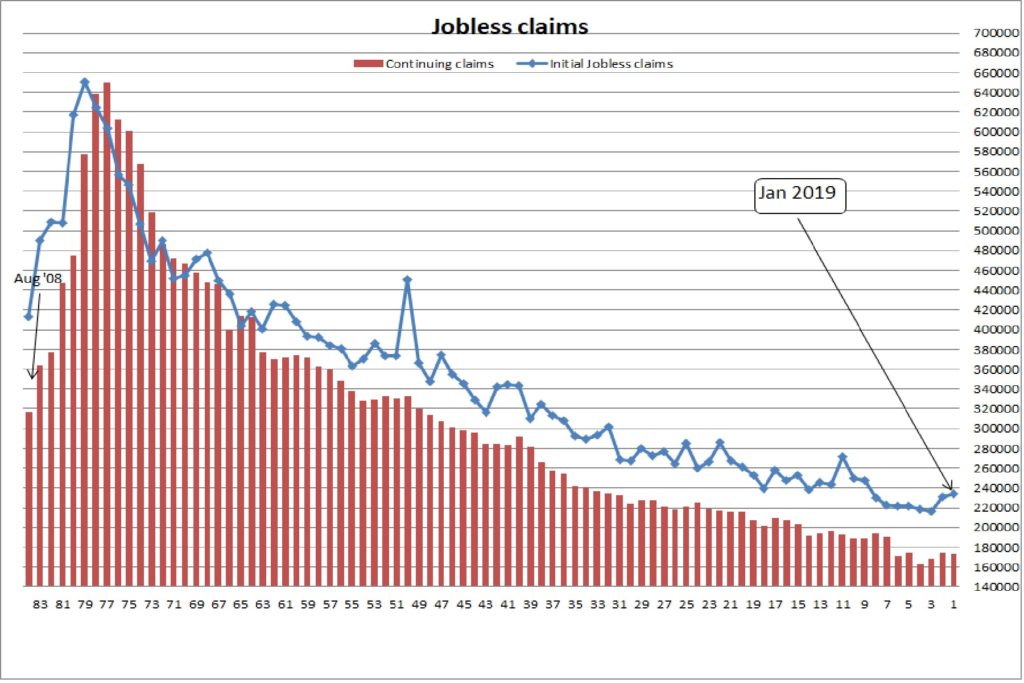
Unemployment Claims 2019
CRYPTOCOMPARE OCTOBER 2018 EXCHANGE REVIEW
- Executive Summary excerpt
Major Exchange News in October
Bitstamp was acquired by Belgium-based Investment Firm NXMH for ~400 million USD according to reports. Cryptoassets on Gemini are now fully insured with Aon. Coinbase adds 0x(ZeroX) to its trading platform as well as USDC (stable coin) after announcing its collaboration with Circle on the CENTRE Consortium. Korean exchange Bithumb starts a new DEX, while Huobi and OKEX list stablecoins GUSD, TUSD, PAX and USDC. Chainalysis will help Binance comply with anti-money laundering (AML) regulations around the globe, and Coinfloor becomes the first exchange to obtain a Gibraltar license.
Country Analysis
Maltese-registered exchanges produce the highest total daily volume at just under 1.4 billion USD, followed by those based legally in South-Korea (~840 million USD) and Hong Kong (~560 million USD). Among the top 10 volume-producing countries, the highest number of large exchanges (with significant volume) are based legally in the USA (8), the UK (8) and Hong Kong (7). Binance and OKEX represent the vast majority of Malta’s volumes, while Bithumb and Upbit dominate in South Korea
For the full report see:
cryptocompare_exchange_review_october_2018