The named entities or Blockchains set forth below do not represent recommendations to purchase or in any way reflect investment advice. One of the key variables that is critical for deciding to invest is missing. That variable is the current valuation of each token or asset vs the overall market and a reasoned forecast of future performance vs the market. What is presented below attempts to inform and to encourage research, to learn about each, and to come to an opinion of whether any of them or all of them strike you as being an important participant in the future development of digital asset platforms. Charts of technical price levels and movements are presented to educate those unfamiliar with price patterns. These examples of real price activity show how prior price levels may be used to identify market points of price resistance or support. Use this information as you see fit, but it is recommended that you see this as an educational/informative tool only. This information is only part of the array of focus areas needed in making any investment decision, accordingly, it is best to not rely on one type of analysis for your capital allocation decisions.
Reading the Tea Leaves
My financial models show the potential for a near-term price increase of $2,000 for Bitcoin, $250 for Ether, and $50 for LiteCoin. The basis for this point of view comes from the current comparisons of:
-
-
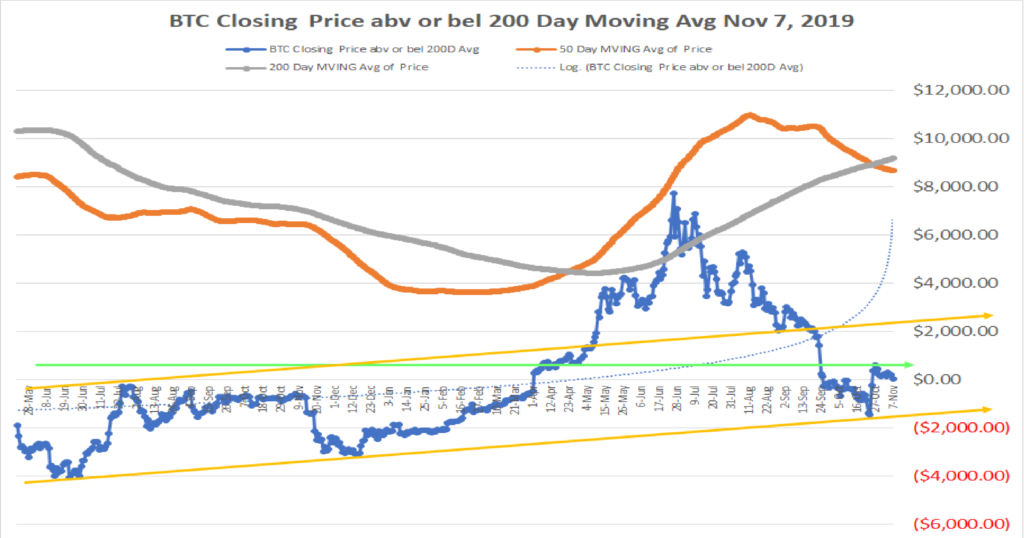
- For the past twelve days the daily closing price of Bitcoin has exceeded the 200 day Moving Average
- Comparing the daily closing prices of Bitcoin, Ether, and LiteCoin to the 50 day Moving Averages reveals the following:
-
- Bitcoin has been above the 50 day MVA for 12 straight days
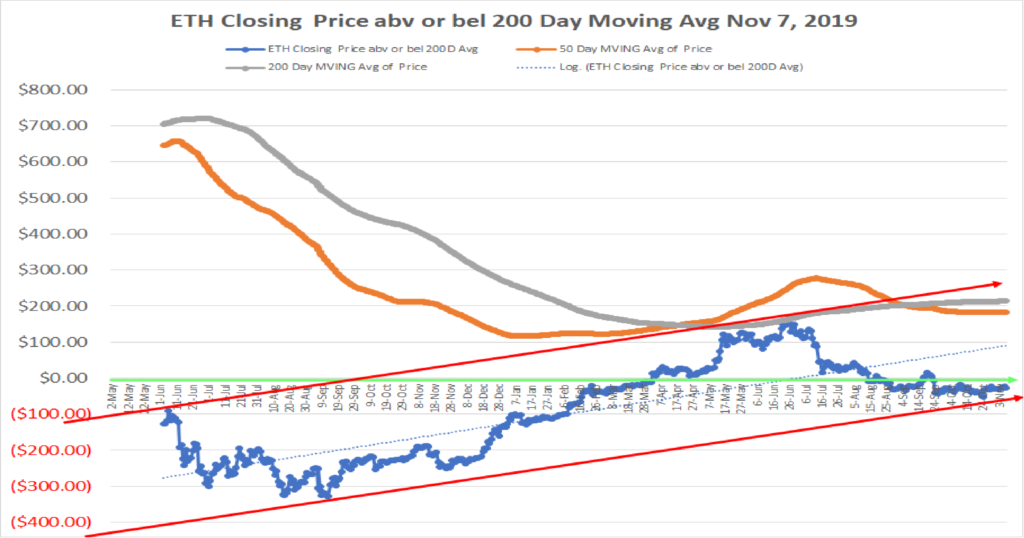
- Ether has been above the 50 day MVA for 6 of the past ten days, with the last 4 days all above the MVA
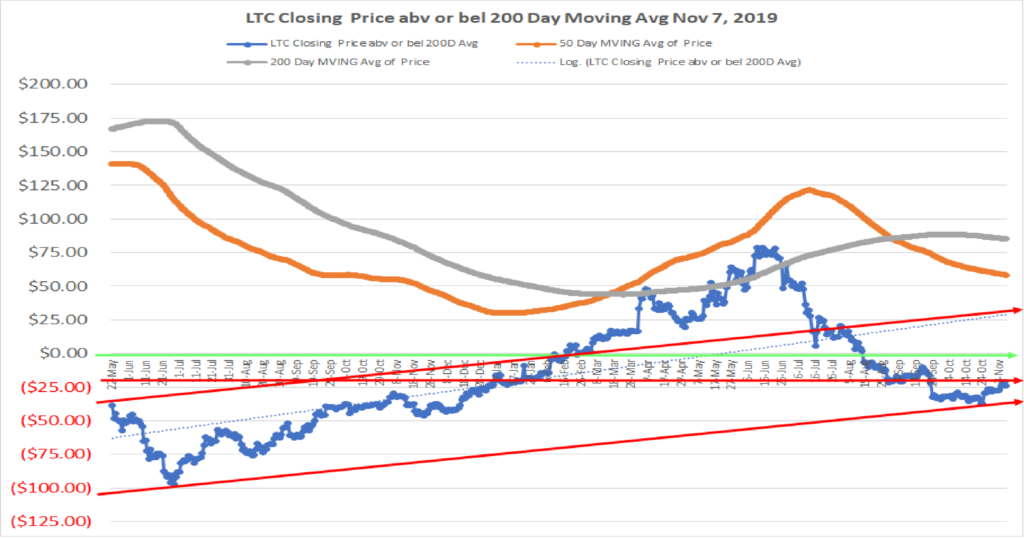
- Litecoin has been above the 50 day MVA for the past 4 straight days
-
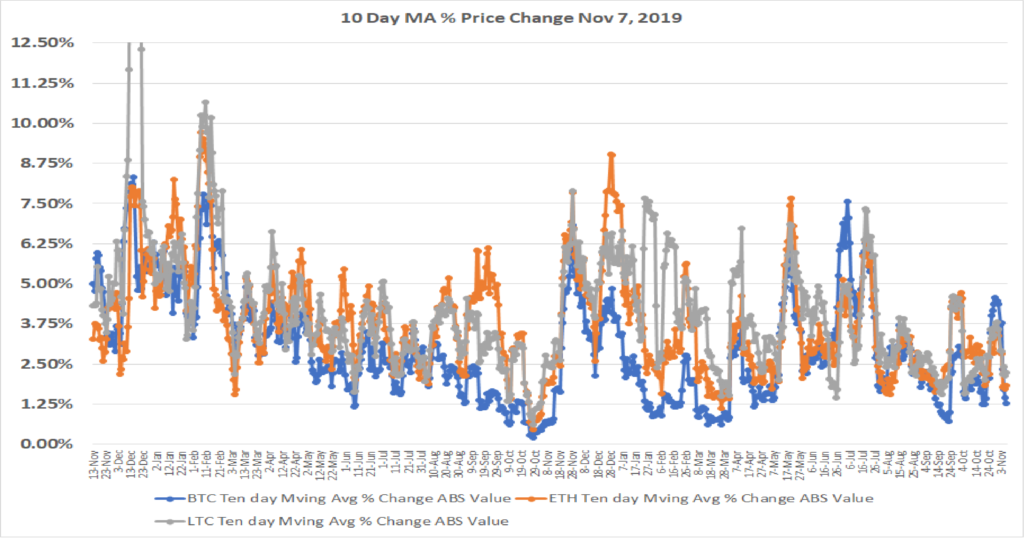
- Price Volatility has been declining. Over time, there have been inflection points where the level of price volatility bottoms or peaks. Currently, the ten day average of Bitcoins price volatility is at 1.28%. Ether price volatility is at 1.84%. LiteCoins price volatility is at 2.23%. These are very low levels of price volatility, and they compare to the most recent high volatility peaks of 7.56% for Bitcoin, 7.65% for Ether, and 7.68% for LiteCoin. The low level of price change portends a period of greater volatility, and the factors at play would point to price changes to the upside (there are some contrary pieces of information that will be discussed below).
- The ten day average of price and volume show a turn upwards in price for Bitcoin and LiteCoin, and a more gradual upward slope for Ether. This is happening at a low point in ten day average volume, yet the action shows higher volume in up days and lower volume on down days. Internally, the bias is higher based on the greater participation of buyers over sellers.
Crypto Volatility
-
The charts of the above metrics are presented below:
200 and 50 day Moving Averages for Bitcoin, Ether and LiteCoin, plus the delta between the current price and the 200 day MVA price
Bitcoin
Ether
LiteCoin
Other important considerations:
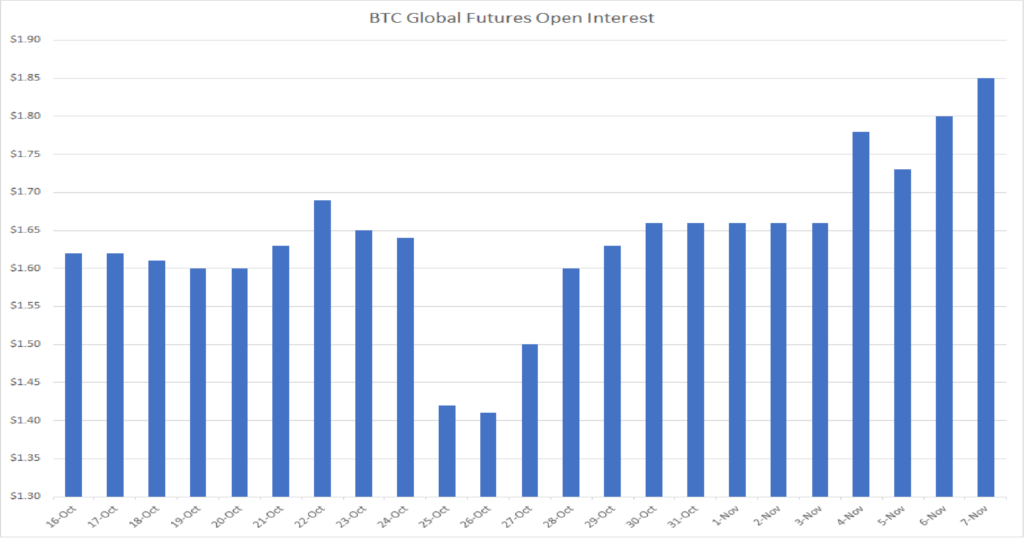
Futures trading in Bitcoin is showing less daily volume but expanding Open Interest. This is similar to the decline in the daily spot trading volume noted above for Bitcoin, Ether and LiteCoin. This decline in volume would normally trouble me, but the expansion in Open Interest tells me that a greater number of positions are being taken in advance of an anticipated price move. This does not indicate which way the price may move, but it does tell me that there is more participation in the market, and that is important. Coupling this with the other factors noted above, and I view this as a positive, with the increase in daily trading to occur once the volatility in prices returns, and I expect that volatility to be to the upside based on current prices flirting with and recently exceeding the 200 and 50 day moving averages.
Bitcoin Global Futures Open Interest in billions of U.S. dollars
The last point, which is the real fly in the ointment for me, focuses on the number of BTC wallets that are active. YTD, there is a 22% increase in wallets, and that is positive from a growth perspective. My concern is that the wallet growth over the past month has slowed significantly, which is not typical of a price break-out to the upside. Price increases are typically preceded by a meaningful expansion in active wallets, and so this perplexes me to some extent. I watch this almost hourly for signs of an uptick that would further validate my thinking that we are close to a meaningful price increase in Bitcoin, Ether and LiteCoin. I will keep you posted on this as it evolves, so check in here frequently for updates on wallet activity.
That about covers it for now. The charts above will be posted to the Charts section of this website. I may add other charts, but not on the front page, so check the Chart section for other chart related data and for the wallet updates.