Keep your buying power ready

The named entities or Blockchains set forth below do not represent recommendations to purchase or in any way reflect investment advice. One of the key variables that is critical for deciding to invest is missing. That variable is the current valuation of each token or asset vs the overall market and a reasoned forecast of future performance vs the market. What is presented below attempts to inform and to encourage research, to learn about each, and to come to an opinion of whether any of them or all of them strike you as being an important participant in the future development of digital asset platforms.  Charts of technical price levels and movements are presented to educate those unfamiliar with price patterns.  These examples of real price activity show how prior price levels may be used to identify market points of price resistance or support. Use this information as you see fit, but it is recommended that you see this as an educational/informative tool only. This information is only part of the array of focus areas needed in making any investment decision, accordingly, it is best to not rely on one type of analysis for your capital allocation decisions.

The market will tell us when to invest

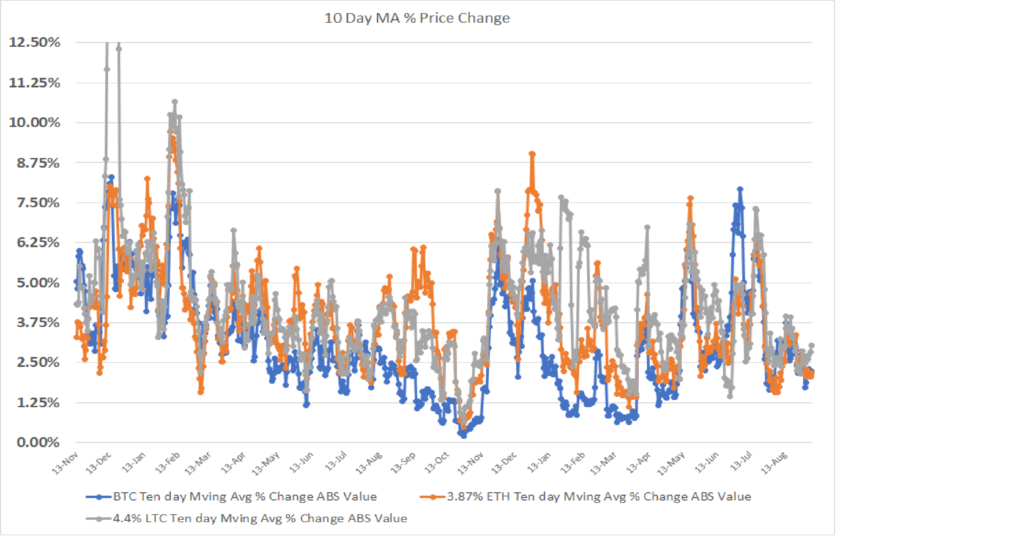
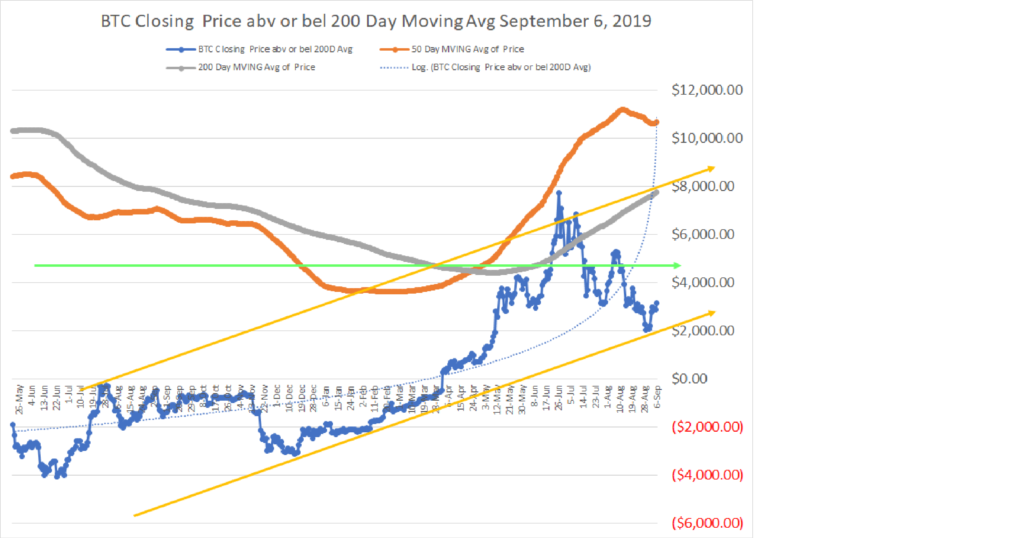
As I noted, the compression of pricing and the decline in volatility were at points that strongly indicated a breakout in prices was imminent. The move could have been higher or lower, but regardless of direction, it was going to be meaningful. My initial observation that BTC had established a new bottom at the $9,000 level was proven wrong.

Well now we know which way the price move took: the break was lower.

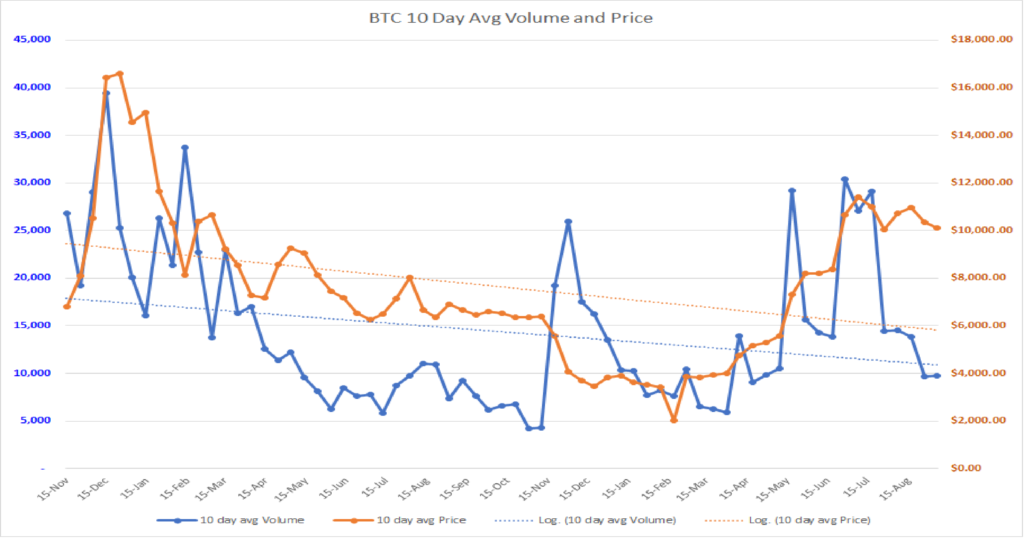
This makes sense given the launch of BAKKT futures this week. The weeks leading up to this were characterized by low volume and steady to lower prices. The action of accumulation in anticipation of the BAKKT launch was missing, and this was an indication that institutional demand pre-launch was lacking. The small number of Bitcoin futures that traded on opening day was a disappointment to the market, and the ensuing price declines reflected that disappointment.

What now?

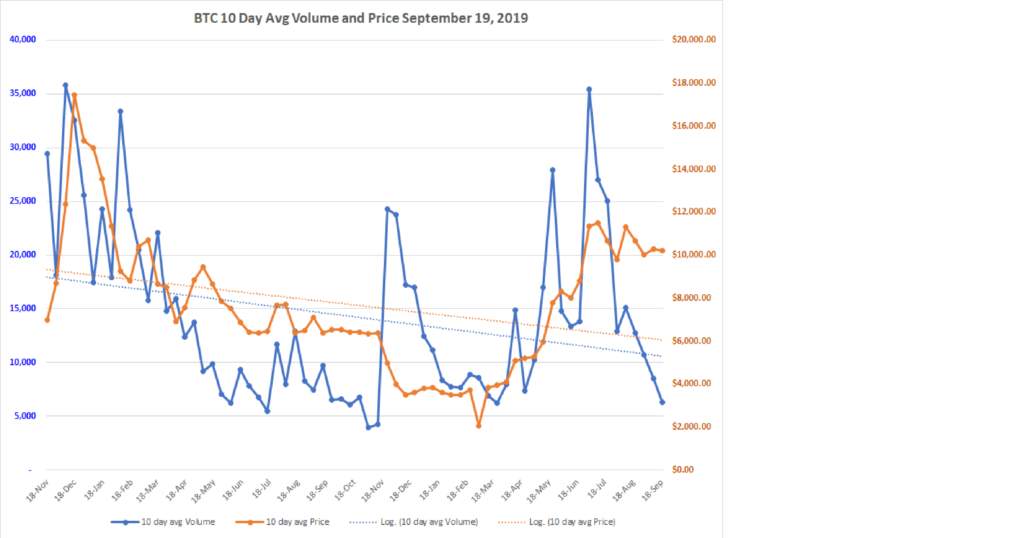
Keep your powder dry. Let the selling exhaust itself. The large volume traded on September 24, 2019 of the crypto-currencies was not record setting, but was meaningful compared to the volumes during the prior time of July through mid-September. Once the dust settles, and there is price and volume stability or a reversal to the upside in price accompanied by volumes greater than the 30 and 60 day averages, then we should consider scaling into new long positions. This will mitigate risk at the cost of missing the early part of the price rise, but in the long-run will serve us well in letting the market confirm price direction on which we may ride the coattails to increasing wealth.

Yesterday, for many, likely felt like my daughter did in this video.

IMG_1202

Bitcoin, Ethereum and LiteCoin appear ready to move out of their range bound pricing

The named entities or Blockchains set forth below do not represent recommendations to purchase or in any way reflect investment advice. One of the key variables that is critical for deciding to invest is missing. That variable is the current valuation of each token or asset vs the overall market and a reasoned forecast of future performance vs the market. What is presented below attempts to inform and to encourage research, to learn about each, and to come to an opinion of whether any of them or all of them strike you as being an important participant in the future development of digital asset platforms.  Charts of technical price levels and movements are presented to educate those unfamiliar with price patterns.  These examples of real price activity show how prior price levels may be used to identify market points of price resistance or support. Use this information as you see fit, but it is recommended that you see this as an educational/informative tool only. This information is only part of the array of focus areas needed in making any investment decision, accordingly, it is best to not rely on one type of analysis for your capital allocation decisions.

The coiled spring

My interpretation of the data for Bitcoin, Ethereum and Litecoin leads me to believe that we are very close to a significant price move. As a bit of background, I love to analyze things, whether it is life, human behavior, a chess board, stocks, or crypto-assets, I take great pleasure in thinking deeply and finding solutions that make the puzzles of my life sensible and enjoyable.

Watching the behavior of the Crypto-currencies in the context of their aggressive move higher in price during May through June of this year, followed by a decline and a leveling off during July through September, the time appears to be at hand where a new base has been laid from which the next period of growth may be at hand.

Bitcoin is now at a point where it is range bound between $9,500 and $10,500. The interesting thing about this is that the volume of Bitcoin traded has reached a relatively low level, a level that coincided with the December 15, 2018 closing price low of $3,183, yet we are trading within a band that is three times higher in price than that December low. The market is telling us that the base price is now reset to this range of $9,000 to $11,000. The move away from this will occur at higher volume and I believe at higher price points vs lower price points. The chart of this price and volume comparison appears as follows:

Bitcoin Price and Volume Chart

BTC, ETH and LTC at a crossroads

Price, Volume, Market Value and Volatility point to a significant move

Below are three charts that are telling a similar story. Before I go there, it is very interesting to find that the combined Market Value of BTC, ETH, and LTC as of September 6, 2019 is roughly equivalent to the mkt value on November 28, 2017 ($216 billion and $215 billion, respectively). If you remember, on that date in 2017 BTC was at $9,949, ready to move to almost $20,000 over the next month. Be ready for a breakout.

The three charts show:

1) A decline in volatility to a point that historically has preceded subsequent large price moves.

2) In a continuing uptrend, the Bitcoin price is at a low point when compared to the 200 Day Moving Average Price.

3) The 10 day Average Bitcoin Price and Volume for Bitcoin show a continuing uptrend during this current basing period.

BTC, ETH,and LTC Volatility under 2%

BTC Price vs 200 Day Moving Average

Ten day Average Price and Volume for Bitcoin