The market is in selling mode. As I write this on Wednesday, April 1, 2020, equities and crypto-assets are declining in price, while Bonds are seeing yields shrink (Ten year treasury now at 0.61%), and the commodity markets see little demand other than for Gold (gold at $1,602 per oz).
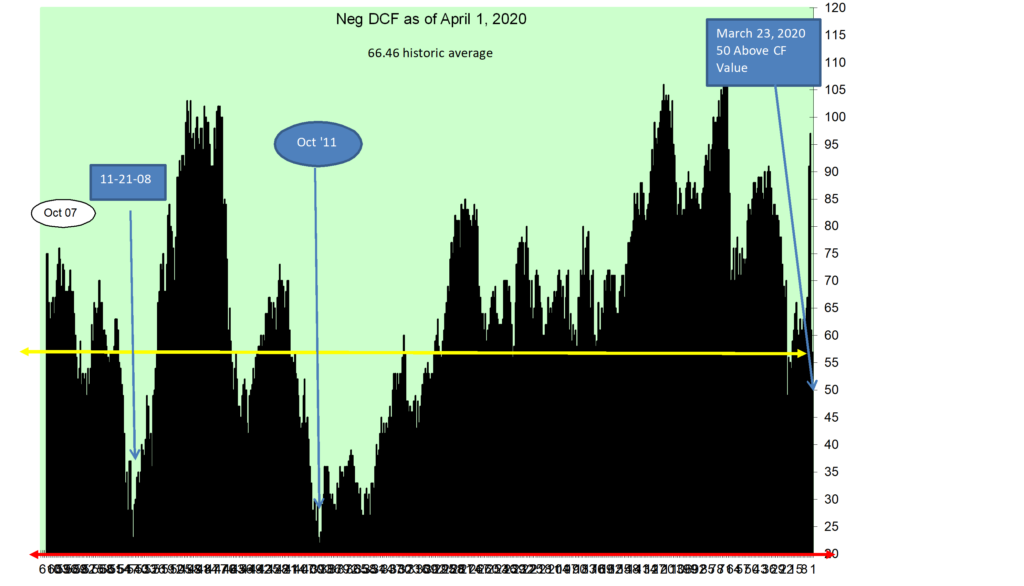
On the equity front, my negative DCF indicator that measures the number of stocks in the 187 Portfolio that are priced above their discounted cash flow value is now at 57. This is lower than the historic average of 66 stocks, but above the March 23rd low of 50 stocks. Presently we are at a buy signal with so few stocks trading above their DCF value, but I remain patient given the disparity between the March 23rd low and now. As you can see in the chart, at other points in time of great uncertainty, the negative DCF count has fallen as low as 29 back in October 2011, which was a great time to be brave and buy stocks.
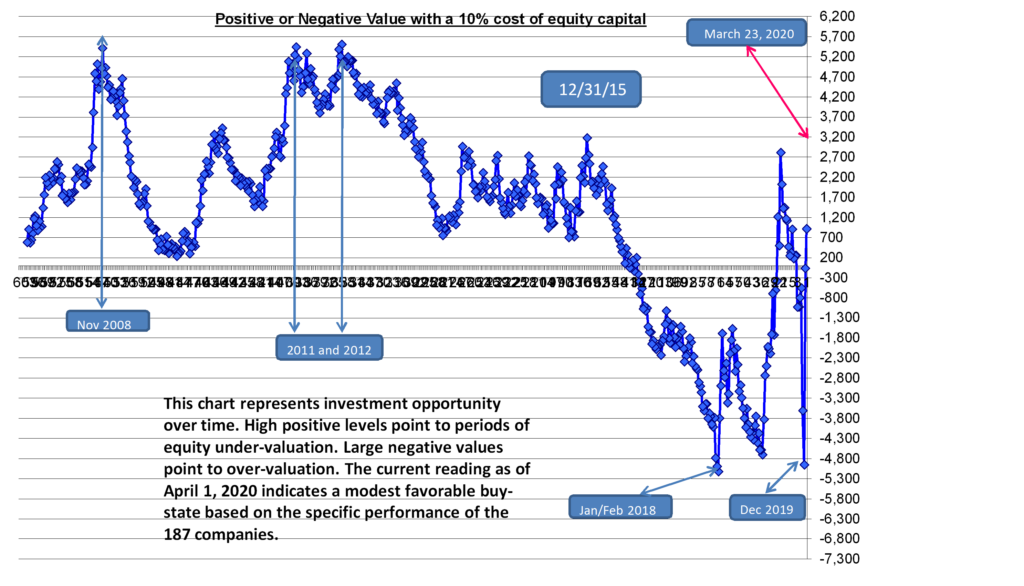
From an investment opportunity perspective my model of the 187 Portfolio as of today, April 1, 2020 shows a modest favorable stock buying environment. At a value of +922, it is below the strong buy signal of +3,200 that existed on March 23, 2020, yet is positive enough to cause me to selectively buy what I consider to be future strong performers. My actions today are modest, slowly building a position for the future, with the expectation that the current market may weaken more, presenting even stronger buy signals in the weeks to come. The investment opportunity chart is below.
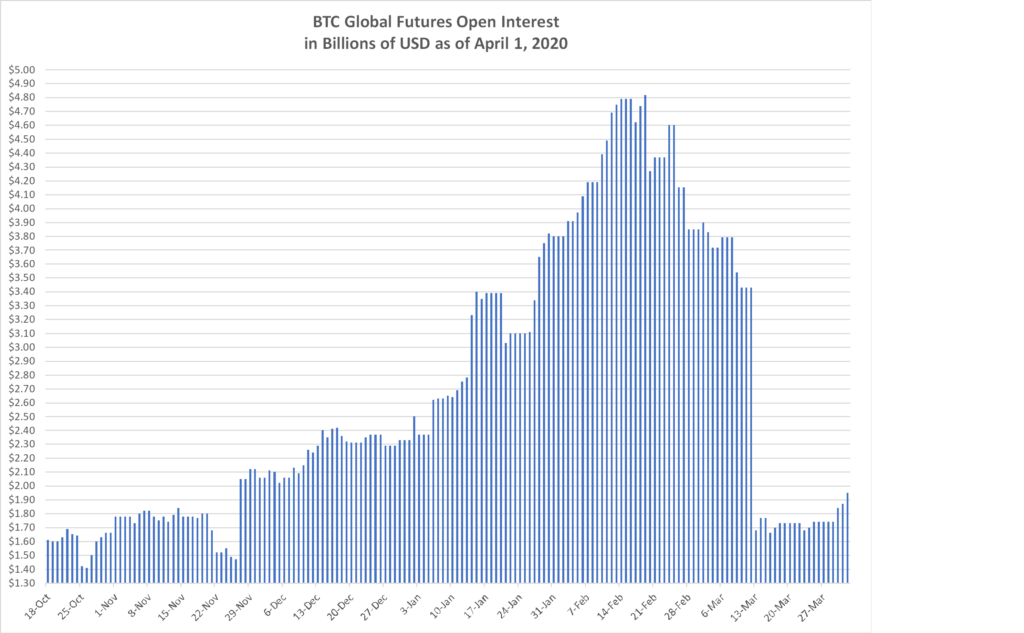
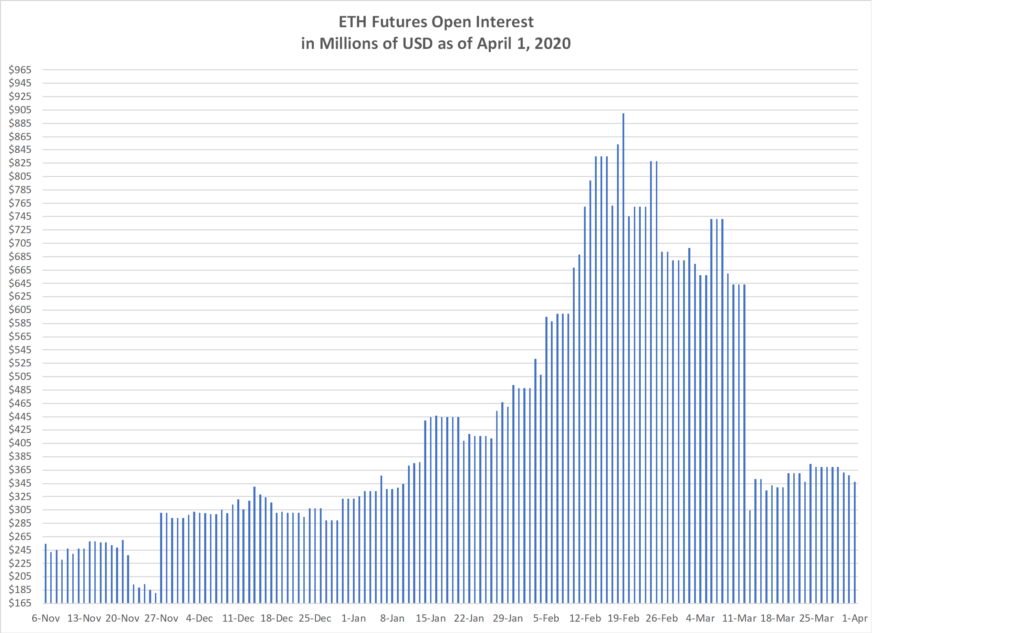
On the Crypto-Asset side of owning and investing, the data by and large indicates a stay on the sideline environment. The declines in the Futures markets is and has been significant. The charts below of Bitcoin and Ethereum Open Interest on the Futures markets reflect the decline in activity. I believe this largely reflects the damage done to Hedge Funds that were leveraged to enable them to own more equities and crypto in the form of Bitcoin and Ether than their available capital alone would permit, and with the dramatic declines in equity prices of +30%, the margin calls have been relentless, causing the liquidation of positions to meet calls on outstanding loans, which included selling and closing Futures positions in Bitcoin and Ether.
The loss of demand on the institution side is a heavy weight at the moment, and absent a pick-up here, the market becomes a retail market. The one bright spot is the growth in the number of Ether addresses. On a run-rate perspective, Ether wallet growth is running at an annual rate of 63%, with a Y-T-D growth through March of 40%.
The named entities and projects do not represent recommendations to buy or sell, or in any way intended to reflect investment advice. One of the key variables that is critical for deciding to invest is missing. That variable is a reasoned forecast of future asset performance vs the market. What is presented attempts to inform and to encourage research, to learn about each asset, and to come to an opinion of whether any of them or all of them strike you as being an important participant in the future development of asset platforms. Charts of technical price levels and movements are presented to educate those unfamiliar with price patterns. These examples of real price activity show how prior price levels may be used to identify market points of price resistance or support. Use this information as you see fit, but it is recommended that you see this as an educational/informative tool only. This information is only part of the array of focus areas needed in making any investment decision, accordingly, it is best to not rely on one type of analysis for your capital allocation decisions.