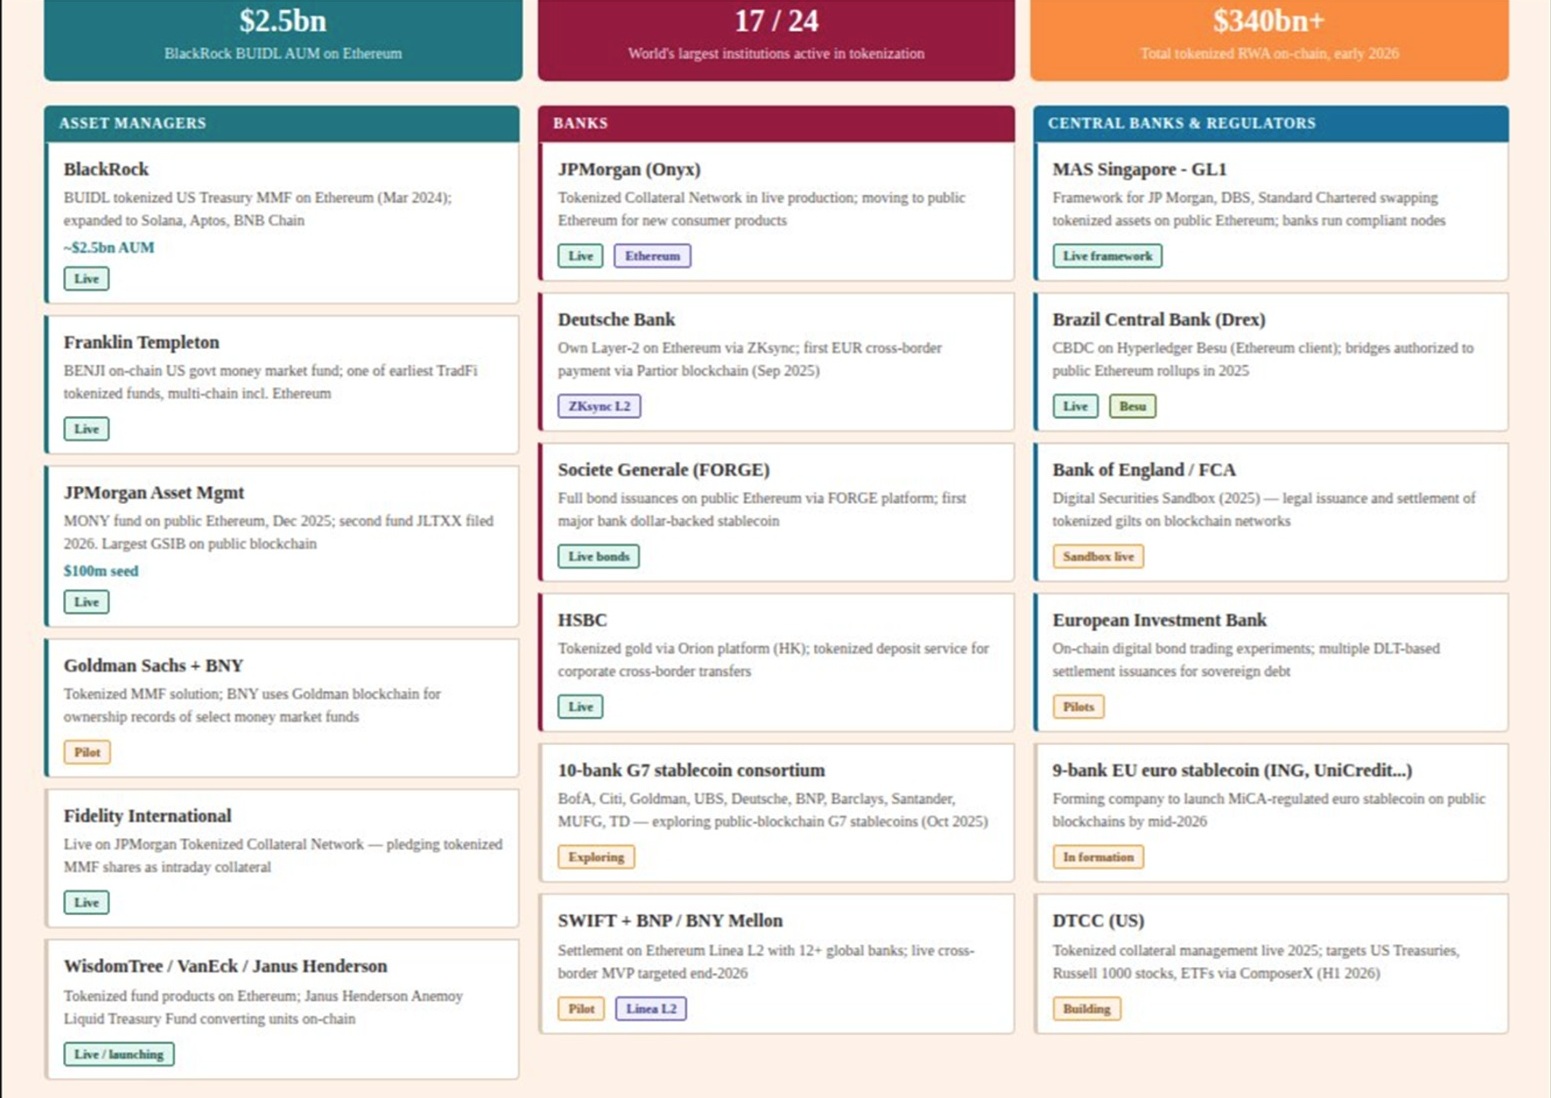
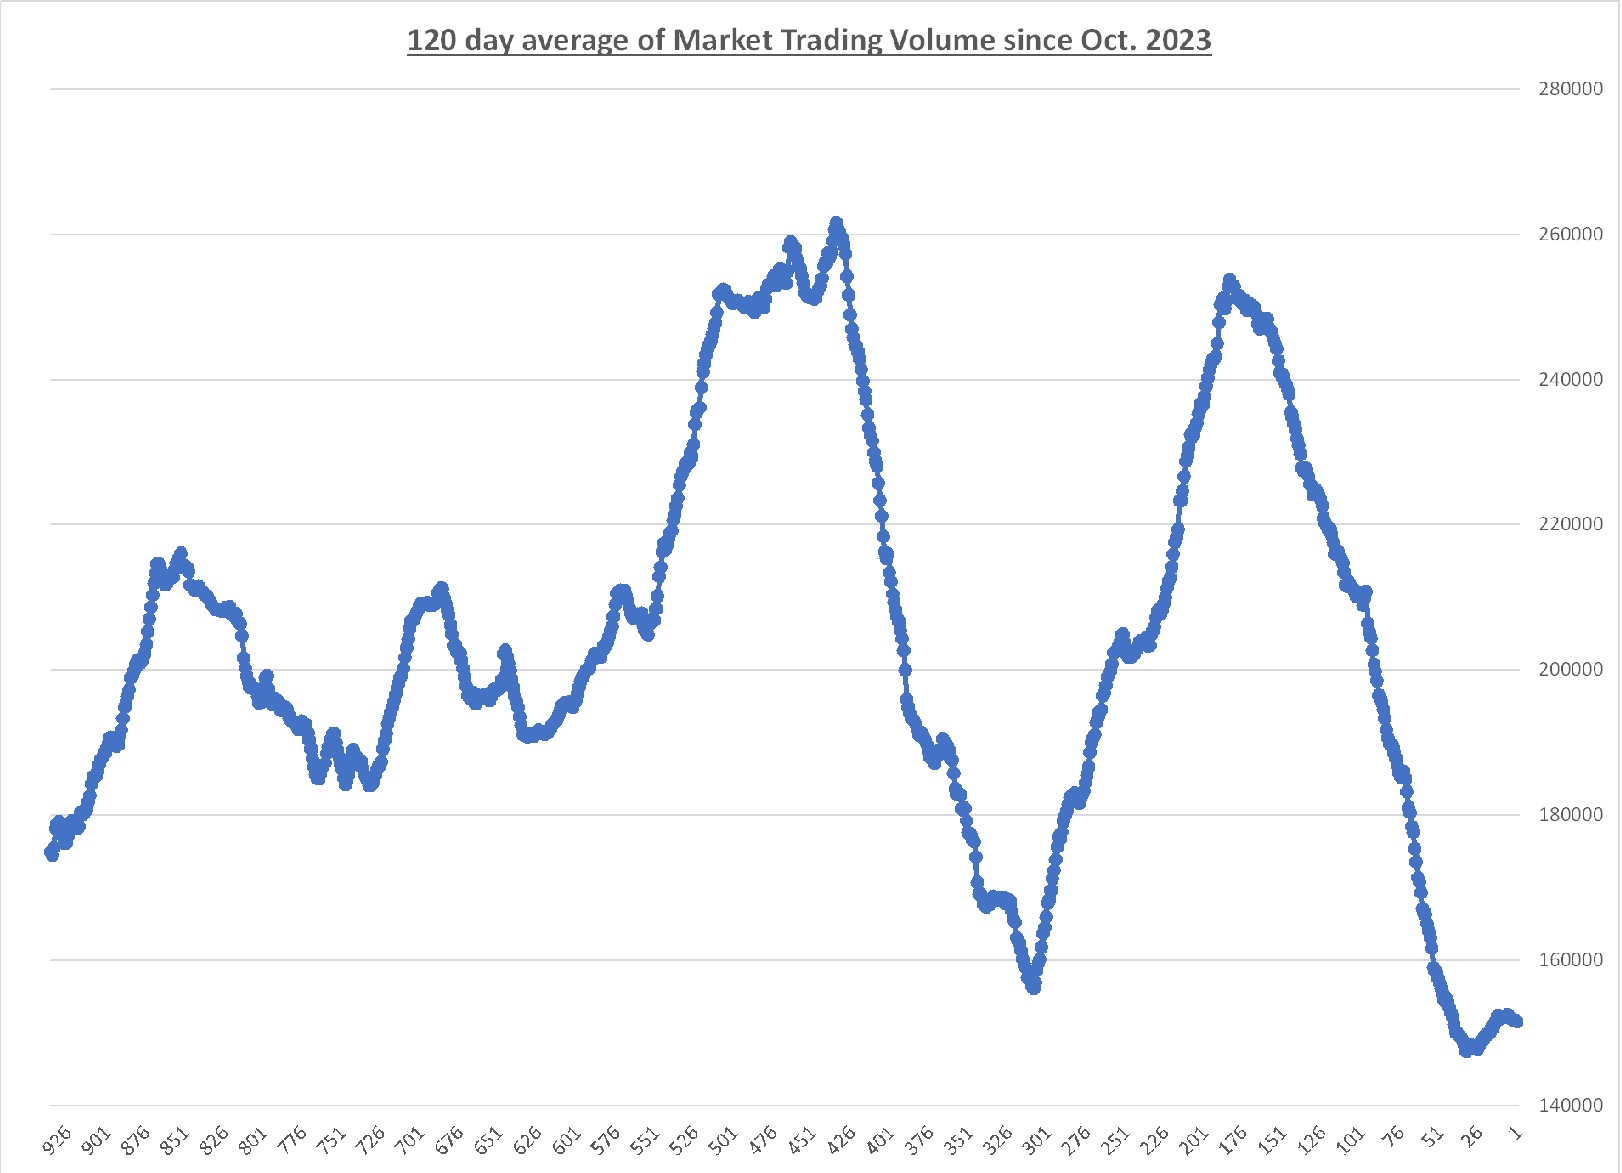
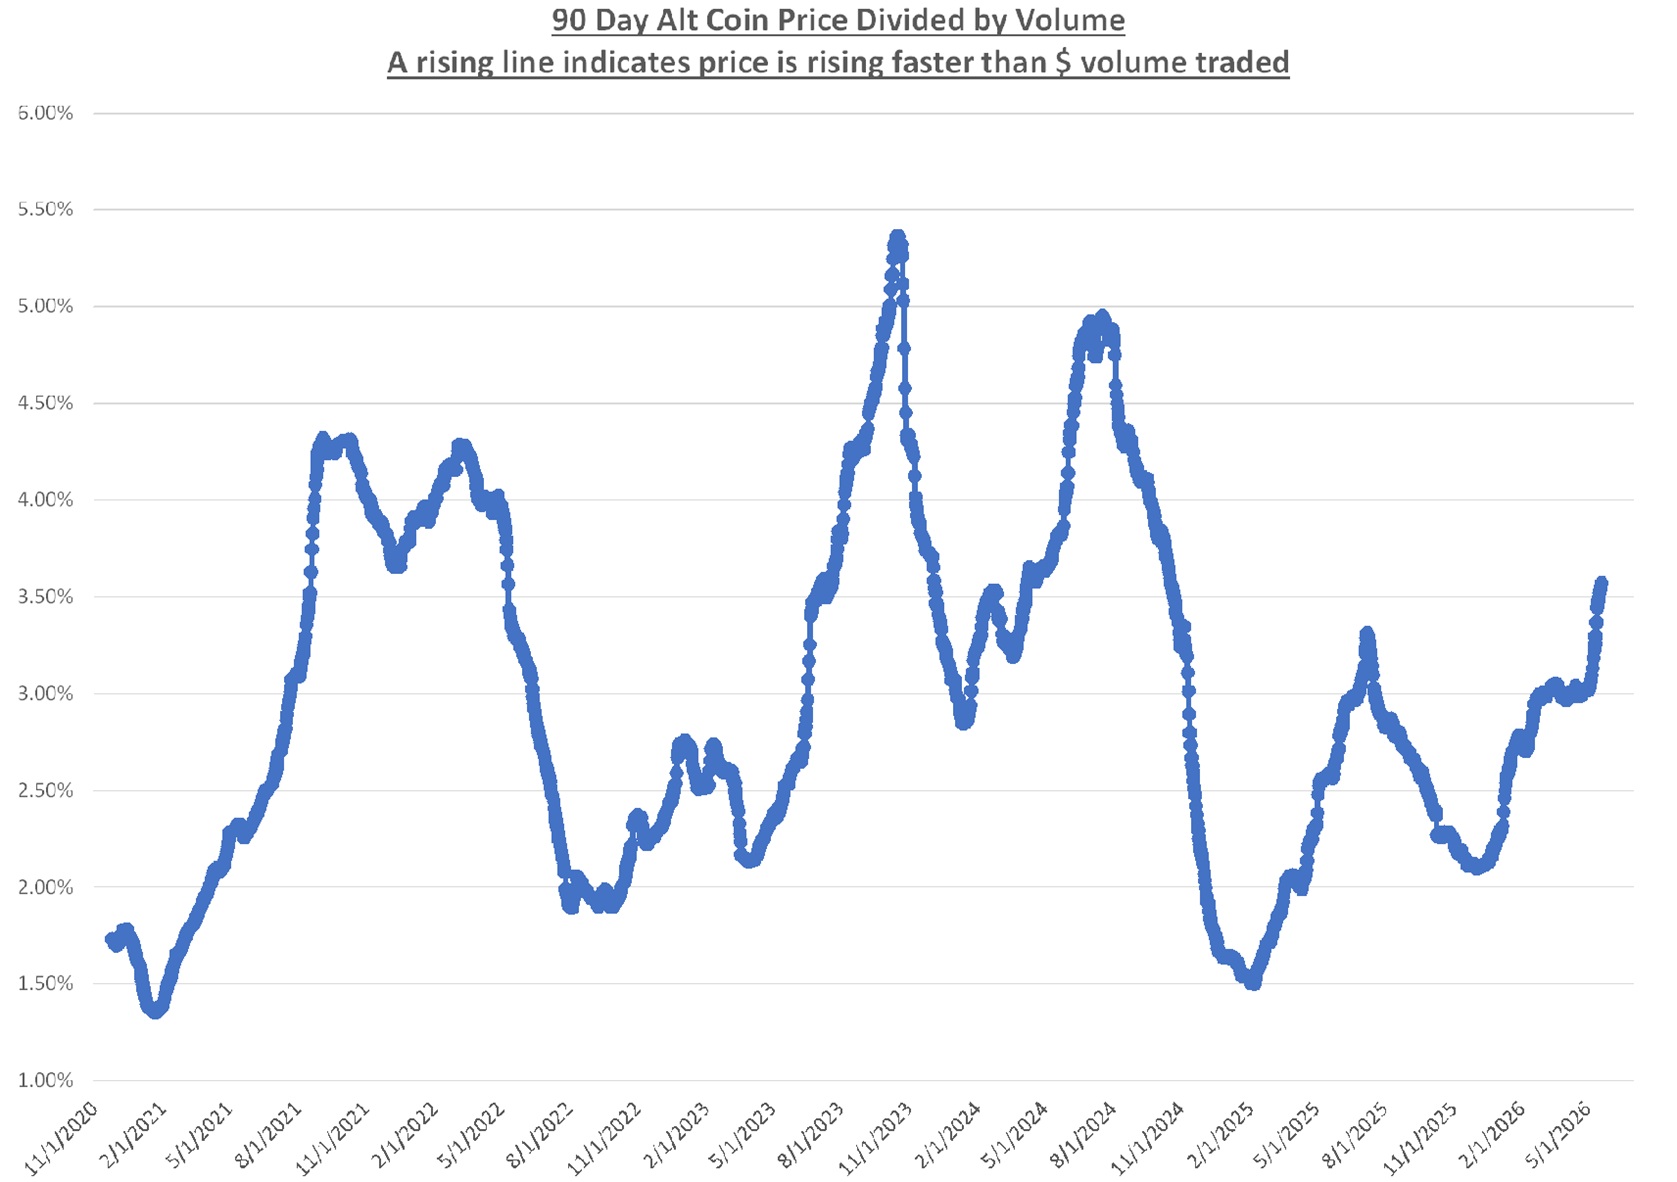
I am an investor and a futurist. For the past 12 years I have been analyzing the companies and participants in the Blockchain and Crypto sectors. As AI has become a dominant investment theme for the future, are there blockchains that are at risk of being displaced by Artificial Intelligence solutions that make blockchains irrelevant?
7:24 AM
Claude responded: This is a genuinely rich strategic question, and the answer is nuanced — it’s not a simple “AI kills blockchain” story.
This is a genuinely rich strategic question, and the answer is nuanced — it’s not a simple “AI kills blockchain” story. Let me give you a structured analytical framework.
________________________________________
Blockchains at Risk of AI Displacement — and Those That Are Not
The core question is: what problem is the blockchain actually solving, and can AI solve it better, cheaper, or faster? The answer varies dramatically by use case.
________________________________________
🔴 HIGH DISPLACEMENT RISK
1. Permissioned / Enterprise Blockchains (Hyperledger, R3 Corda, Quorum) These were built to solve trust problems between known counterparties — banks, supply chain partners, insurance companies. AI-driven orchestration systems are now handling this more elegantly. In 2025, banks, fintechs and corporates stopped debating which rail would “win” cross-border payments; instead, they built AI-driven multi-rail orchestration systems that dynamically route across cards, ACH, real-time networks, and local clearing — with blockchain used only where it adds specific value in specific corridors. The enterprise blockchain pitch — “we need a shared ledger among partners” — weakens significantly when AI can manage trust, reconciliation, and settlement without requiring every participant to run a node. PYMNTS.com
2. Supply Chain Traceability Blockchains Platforms like VeChain and IBM Food Trust were positioned as the solution for provenance and traceability. AI is displacing this in practice. AI forecasts demand, predicts delays, and optimizes inventory while blockchain preserves provenance records — but increasingly, AI-powered centralized databases are achieving the same provenance goals without the coordination overhead. Unless regulators specifically mandate on-chain records, these use cases are vulnerable. Blockchain Council
3. Governance / Voting DAOs Decentralized autonomous organizations were supposed to replace corporate governance structures. In practice, AI agents can now execute complex multi-party decision-making, negotiation, and resource allocation far more efficiently than slow on-chain voting mechanisms. The governance token model is under structural pressure.
________________________________________
🟡 MODERATE / EVOLVING RISK
4. Layer-1 Smart Contract Platforms for Middleware Use Cases Ethereum, Polygon, Avalanche, and similar chains built ecosystems around smart contracts automating agreements. The risk here is selective: by early 2026, the industry is implementing systems where AI can decide, blockchains can verify, and payments can execute automatically — a self-coordinating model where software agents perform economic work without constant human intervention. This is convergence, not displacement — but it means the blockchain becomes an audit/settlement layer rather than the primary logic layer. Chains that can’t adapt to being “AI’s back-end” lose relevance. Blockchain Council
5. Identity and KYC Blockchains Self-sovereign identity projects (Civic, Ontology, uPort) were blockchain-native. AI-driven identity verification — biometrics, behavioral analysis, document AI — is far more user-friendly and is being adopted rapidly. One of the promises of blockchain in payments has been portable, verifiable digital identities that individuals or businesses control, but this vision is losing ground to AI-native identity solutions that don’t require users to manage keys or understand decentralization. Medium
6. Prediction Markets and Oracle Networks Chainlink and similar oracle projects exist to bring real-world data on-chain. As AI agents become the primary consumers and producers of data, the economics of decentralized oracle networks get squeezed. If an AI agent both generates and acts on data within a single trusted execution environment, the oracle middleman becomes unnecessary.
________________________________________
🟢 LOW DISPLACEMENT RISK — Potentially AI-Enhanced
7. Bitcoin (as a Store of Value / Monetary Network) Bitcoin’s value proposition is not computational — it’s political and monetary. More agile players like Ethereum or Solana may be better able to support automated economic interactions and offer blockchain identity solutions, but Bitcoin’s role as a neutral, censorship-resistant store of value is actually strengthened as AI centralizes economic power in the hands of a few hyperscalers. The more dominant AI becomes, the stronger the case for a monetary system no AI company controls. The Motley Fool
8. Public Settlement Layers for AI Agents This is the most interesting opportunity. By 2026, AI makes decisions, blockchains prove them, and payments enforce them instantly without human middlemen — meaning programmable public blockchains become the settlement infrastructure for AI-to-AI transactions. Ethereum, Solana, and Base are well-positioned here. An AI agent needs a trustless way to pay another AI agent; a public blockchain is the natural rail. Entrepreneur
9. Decentralized AI-Specific Blockchains Networks like Bittensor (TAO), Render, and Akash are built for AI workloads — decentralized compute, model training, and inference markets. Bittensor enables AI models to collaborate and compete within a token-incentivized network, demonstrating market-driven approaches to pricing model performance and allocating compute resources. These are not at risk of AI displacement — they exist because of AI’s rise. Blockchain Council
________________________________________
The Underlying Pattern: Developer Capital Is Already Voting
The most data-driven signal comes from GitHub: developer activity in blockchain projects has dropped sharply since early 2025, with weekly crypto code commits down about 75% and active developers falling 56%, even as overall GitHub usage grows — with AI-related repositories and LLM projects absorbing much of that talent and effort. This is the market’s clearest signal about where human intellectual capital sees the future. CoinDesk
________________________________________
Strategic Framework for Your Portfolio
Blockchain Category AI Threat Level Rationale
Enterprise/Permissioned (Hyperledger, Corda) 🔴 High AI orchestration solves the same trust problem more simply
Supply chain traceability (VeChain, IBM FT) 🔴 High AI + centralized DB increasingly sufficient
DAO governance tokens 🔴 High AI agent coordination is faster and more efficient
Oracle networks (Chainlink) 🟡 Medium Squeezed as AI agents internalize data
Smart contract L1s (ETH, SOL) 🟡 Medium Survive if they adapt to be AI settlement rails
Self-sovereign identity chains 🟡 Medium Losing to AI-native identity products
Bitcoin 🟢 Low Monetary role strengthens as AI centralizes power
AI-native blockchains (Bittensor, Render) 🟢 Opportunity Built for AI; beneficiaries, not victims
Public settlement rails for AI agents 🟢 Opportunity AI-to-AI transactions need trustless settlement
The most defensible position in your portfolio is likely at the intersection — blockchains that are becoming infrastructure for AI rather than competing against it. The ones to watch most carefully for obsolescence are the enterprise and middleware chains that were solving coordination problems AI can now handle more elegantly.
You said: Please expand and contrast the AI solving coordination problems to the business goal of Quant which wants to be the connective tissue for Central Banks and the…
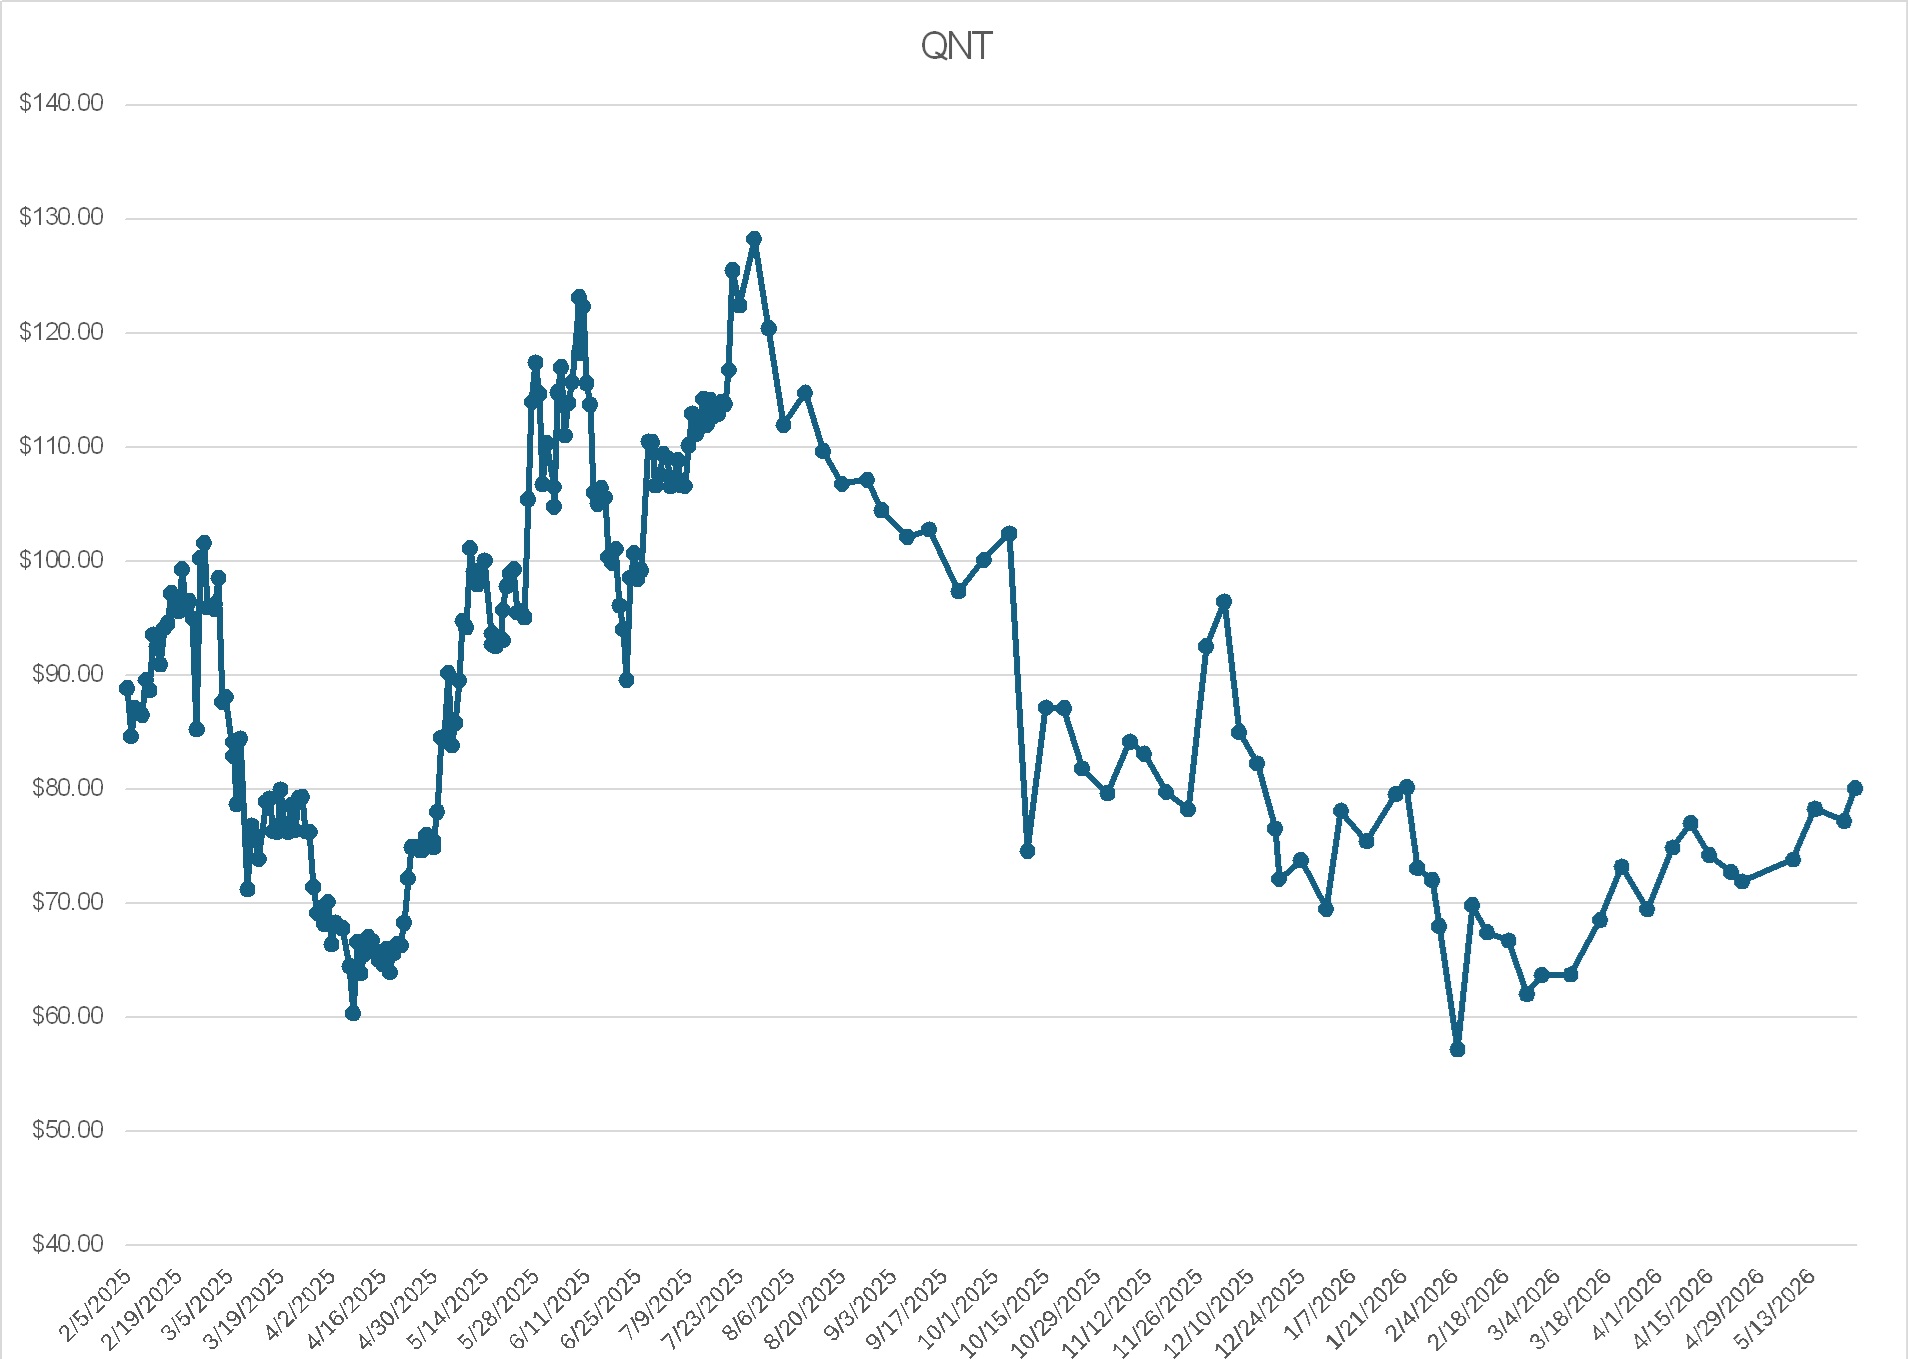
Please expand and contrast the AI solving coordination problems to the business goal of Quant which wants to be the connective tissue for Central Banks and the global banking system across multiple private blockchains?
7:46 AM
Claude responded: This is a genuinely sophisticated analytical question — and Quant’s case is materially different from the generic enterprise blockchain displacement risk I out…
This is a genuinely sophisticated analytical question — and Quant’s case is materially different from the generic enterprise blockchain displacement risk I outlined in our previous discussion. Let me break it down carefully.
________________________________________
Quant/Overledger vs. AI Coordination: Why They Are Not the Same Problem
First, What Quant Actually Does
Quant is not a blockchain. It is a protocol-agnostic interoperability layer — essentially a financial operating system that sits above multiple blockchains simultaneously. Overledger is designed as a protocol-agnostic API gateway that can connect permissioned enterprise blockchains and public blockchains — conceived by Gilbert Verdian in 2016 while he was working on the ISO Standard TC307 for enterprise blockchains to improve cross-ledger communication. That origin matters enormously: Quant was born inside the standards bodies that govern how financial institutions talk to each other. Messari
Overledger OS acts as an API gateway that connects over 45 public and private blockchains — including Bitcoin, Ethereum, Hyperledger Fabric, and emerging CBDC networks — without the security risks of bridges or wrapped assets. Ventureburn
This distinction — no bridges, no wrapped assets, native API orchestration — is the crux of the AI displacement debate.
________________________________________
What AI Does When It “Solves Coordination Problems”
When we say AI eliminates blockchain middleware for coordination, we’re describing a specific class of problem: trusted data reconciliation between known counterparties. Think of two banks that need to confirm a payment cleared. Historically, blockchain offered a shared ledger so both parties could see the same immutable truth. AI-driven orchestration can now do this more dynamically — routing across SWIFT, ACH, Fedwire, or any rail in real-time without requiring every party to maintain a node.
Banks, fintechs and corporates stopped debating which rail would “win” cross-border payments; instead, they built AI-driven multi-rail orchestration systems that dynamically route across cards, ACH, real-time networks, and local clearing — with blockchain used only where it adds specific value in specific corridors. PYMNTS.com
This is the AI coordination story. It is powerful — and it does threaten generic enterprise blockchain middleware like early Hyperledger deployments.
________________________________________
Why Quant’s Use Case Is Structurally Different
Here is the key distinction: AI orchestration solves routing and reconciliation. It does not solve sovereign trust, legal finality, or programmable settlement across incompatible monetary systems. Quant is operating in a regime where those harder problems dominate.
1. The Sovereign Trust Problem
When the Bank of England, the ECB, the BIS, and HSBC need to transact, the question is not “which rail is fastest?” It is: “How do we achieve atomic, legally final settlement across jurisdictions with different legal systems, different ledger architectures, and different monetary authorities?” That is not a routing problem. It is a sovereignty and finality problem.
Quant has been selected by UK Finance and a consortium of leading commercial banks to provide the technology underpinning the UK’s new tokenised sterling deposits (GBTD) project — including advanced programmable payments and interoperability across bank ledgers, RTGS, Faster Payments, Open Banking and tokenised deposit platforms. This is live regulated financial market infrastructure, not a pilot for routing optimization. Quant
2. The Standards Moat
Quant has an institutional moat that AI systems cannot quickly replicate. Quant spearheaded the Blockchain ISO Standard TC307, adopted by 57 countries, and solved interoperability with the creation of the world’s first interoperable blockchain platform, Overledger. Being embedded in the standards themselves — the IETF’s Secure Asset Transfer Protocol (SATP), ISO 20022 — is a different category of competitive advantage than being a smart routing algorithm. Financial regulators don’t adopt standards by algorithm. They adopt them through years of working groups, legal review, and treaty-adjacent agreements. Quant
3. The CBDC Programmability Layer
This is Quant’s most defensible forward position. Overledger Platform makes the same enterprise-grade technology, the same interoperability core, the same secure smart contracts, and the same issuance, secure bridging, and atomic settlement functionality that underpinned Quant’s projects with institutional and central bank customers — available via SaaS. The Bank of England and BIS’s Project Rosalind was not a routing efficiency exercise — it was exploring how programmable money can have logic embedded in the currency itself. No AI orchestration layer can replicate programmable money because it’s not a software coordination problem — it is a monetary architecture question. Quant
4. The Regulatory Moat Accelerating
UK Finance’s September 2024 report concluded that a blockchain-powered Regulated Liability Network could enable programmable payments, cut fraud, and reduce the cost of failed transactions in a system that processes $14.5 trillion annually in UK payments. When a government-backed trade association and six of the largest banks in the world validate that conclusion and then select Quant as the infrastructure provider, that is a fundamentally different investment thesis than a middleware startup hoping for enterprise adoption. Yahoo Finance
________________________________________
The Core Contrast: AI Coordination vs. Quant’s Actual Competitive Space
Dimension AI Coordination Layer Quant / Overledger
Problem solved Routing & reconciliation between known parties Atomic settlement across sovereign monetary systems
Trust model Algorithmic / probabilistic Legally final / cryptographic
Counterparties Banks and fintechs with existing relationships Central banks, regulators, sovereign ledgers
Standards position None inherent ISO TC307, IETF SATP, ISO 20022 compliant
Deployment status Multi-rail orchestration live in payments BIS Rosalind, UK RLN, GBTD mid-2026
AI threat level — Low to very low for core use case
AI opportunity Could optimize routing within Overledger AI agents increasingly need Overledger’s settlement rails
________________________________________
The Unexpected Upside: AI Makes Quant More Valuable, Not Less
By early 2026, the industry is implementing systems where AI can decide, blockchains can verify, and payments can execute automatically — a self-coordinating model where software agents perform economic work without constant human intervention. If this trajectory holds, Quant’s settlement layer becomes more critical as AI agents proliferate, not less. An AI agent transacting on behalf of a bank needs a trustless, legally final settlement rail. Overledger is precisely that infrastructure. Blockchain Council
Autonomous agent transactions could reach $30 trillion by 2030, and those transactions need programmable, compliant settlement infrastructure. Quant’s PayScript engine and Overledger are built exactly for that moment. Ainvest
________________________________________
Legitimate Risks That Remain
To be balanced, Quant is not without risk:
Competitive displacement — when focusing on Quant’s collaboration with banks in the CBDC sector, Ripple emerges as a direct competitor — and Polkadot and Cosmos compete on the interoperability dimension. mBridge (BIS’s multi-CBDC platform) is a parallel sovereign effort that could reduce the need for a private interoperability layer if central banks build their own connective tissue directly. Godex
Execution risk — the token remains down significantly from its all-time highs, and Overledger Fusion (the mainnet upgrade) is still forthcoming. Pilots becoming production systems at global scale is never guaranteed.
Disintermediation by CBDCs themselves — if a global CBDC standard emerges with native interoperability built in (perhaps through mBridge or a BIS-led protocol), the demand for a third-party interoperability layer could diminish. This is perhaps the most underappreciated structural risk.
________________________________________
Bottom Line
Quant is one of the few blockchain-adjacent projects where the AI displacement thesis genuinely inverts. Generic enterprise blockchain middleware is threatened because AI can handle the coordination problem more cheaply. Quant is positioned at the layer where the coordination problem is not merely technical — it is sovereign, legal, and monetary. That is a territory AI orchestration cannot easily colonize, and where Quant’s seven-year head start in standards bodies, central bank relationships, and regulatory compliance creates a moat that is qualitatively different from software-layer competition.
The question for you as an investor is not “will AI displace Quant?” — it is more likely “will central banks ultimately build their own interoperability standard and cut out the private layer?” That is the bear case worth stress-testing.
You said: I want to switch gears a bit.
I want to switch gears a bit. AAVE has experienced internal turmoil amongst its leaders and key token holders. The price of the AAVE token has depreciated quite significantly. With a large TVL and earnings, the future looked promising as a financial tool for the future. Has AI and competition reduced the future opportunities for success with the AAVE platform?
8:04 AM
Claude responded: This is a rich and layered situation.
This is a rich and layered situation. Let me give you a thorough, structured analysis — separating the governance crisis, the competitive landscape, and the AI question, because they are distinct threats with different severity profiles.
________________________________________
AAVE: A Three-Dimensional Threat Analysis
I. The Governance Crisis — What Actually Happened and Where It Stands
The crisis was triggered by a specific event in December 2025 that escalated into something far more structurally damaging. On December 4, 2025, Aave Labs announced the integration of CoW Swap into the Aave interface; one week later, on-chain analysis revealed that swap fees generated through the integration were being routed to a private wallet controlled by Aave Labs, not the DAO treasury — analysis suggesting this could divert roughly $10 million per year away from token holders without a DAO vote. Our Crypto Talk
Marc Zeller of the Aave Chan Initiative called it “stealth privatization,” and what followed was a cascading collapse of trust. The drama caused a selloff of roughly 25% due to governance uncertainty, as capital allocators value enforceable rights to revenue. Substack
The contributor exodus is the more serious structural wound. Three of Aave’s most critical independent operators left in rapid succession:
• BGD Labs ended its four-year engagement as core technical contributor on April 1, 2026, citing changes in the DAO’s organizational dynamics and strategic disagreements over the development of Aave V3 and V4. Phemex
• Chaos Labs exited citing “fundamental misalignment” on risk strategy, rising complexity from V4, and unsustainable economics despite a $5 million budget proposal from Aave Labs to retain them. CoinDesk
• ACI (Aave Chan Initiative), the protocol’s largest governance delegate, also wound down.
The exits of Chaos Labs, ACI, and BGD Labs leave Aave’s DAO with fewer seasoned operators just as the protocol rolls out its next-generation V4 architecture and pushes deeper into institutional-grade features. This is not a temporary optics problem — these are the people who priced every loan on the protocol, wrote the core code, and managed risk through multiple market crises. Their institutional knowledge cannot be quickly replaced. Crypto News
The resolution — partially: Aave governance approved the “Aave Will Win” proposal in April 2026, directing 100% of revenue from all Aave-branded products to the DAO and consolidating economic rights under the AAVE token — ending the months-long dispute over fee redirection. Protocol revenue, which hit $140 million in 2025 and is tracking to match that in 2026, now flows to token holders. This is genuinely significant — it transforms AAVE from a pure governance token into a cash-flow accruing asset. But the talent loss cannot be undone by a governance vote. CoinDesk
________________________________________
II. The Competitive Landscape — DeFi Rivals Are Real but Not Existential
Despite the internal chaos, Aave’s competitive moat remains large but is eroding at the margins. Aave ended 2025 with 61.5% active loan market share and 52.4% lending TVL share. The margin against Morpho, its closest rival, is roughly 4.1 times. Spark, the third-largest competitor, sits at $967.52 million in borrowed funds. CryptoRank.io
DeFi lending protocols hold $54 billion in deposits as of April 2026. Aave V3 leads at $19.4 billion, followed by Spark at $6.8 billion, Morpho Blue at $4.9 billion, Compound V3 at $2.7 billion, and newer entrants like Fluid and Euler V2 growing 3–5x year over year. Eco
The competitive threat worth watching is Morpho’s architectural innovation. Two structural shifts changed the competitive picture since 2024: Morpho’s rise from $2 billion to $10 billion-plus on institutional adoption through its modular Blue + Vaults architecture that pulled curated yield away from monolithic pool lenders, and Coinbase’s USDC lending launch in late 2025 routing retail deposits through Morpho Vaults, proving that CeFi-to-DeFi pass-through is now a real volume channel. Eco
Morpho’s architecture is more modular and capital-efficient — it typically offers tighter spreads because curators optimize across multiple markets, often beating Aave by 50–100 basis points on equivalent markets. That is a structural efficiency gap Aave is attempting to close with V4. Eco
________________________________________
III. The AI Question — Where It Applies and Where It Doesn’t
This is where your question gets most interesting, because AI’s impact on AAVE is neither simple displacement nor simple enhancement. It operates on three levels:
Level 1: AI does NOT threaten AAVE’s core primitive
Overcollateralized on-chain lending is fundamentally a smart contract problem, not a coordination problem. The reason Aave exists is not to help parties trust each other — it’s to provide algorithmic, non-custodial credit with transparent liquidation rules. An AI system cannot replicate this because the value proposition is trustlessness and permissionlessness, not routing efficiency. No AI middleware can replace a protocol that holds $19 billion in collateral without a counterparty.
Level 2: AI actually creates significant new demand for AAVE
The most visible change is the rise of AI agents that can hold and use wallets to execute tasks: rebalancing treasury positions, paying for APIs and compute, placing orders, managing subscriptions, and interacting with DeFi and tokenized assets. For AI agents operating autonomously and needing to deploy capital, borrow stablecoins, or manage liquidity — Aave is the natural on-chain financial layer. The protocol has processed roughly $3.33 trillion in cumulative deposits and nearly $1 trillion in loans. That liquidity depth is irreplaceable for autonomous agents needing reliable, large-scale financial infrastructure. Blockchain CouncilCrypto News
Level 3: AI creates a new competitive threat to Aave’s risk management model
This is subtle but important. Aave’s V4 architecture is more complex, and the departure of Chaos Labs — which had managed risk across Aave V2 and V3 since November 2022 with zero material bad debt — removes the human institutional knowledge that kept the protocol safe through volatile markets. If Aave cannot replace this with equivalent AI-driven risk models quickly, the V4 expansion into RWAs and institutional lending carries real systemic risk. This is partly why April’s $293 million Kelp DAO exploit caused significant bad debt on Aave at the worst possible moment — right as its experienced risk managers were walking out the door. CoinDeskCoinMarketCap
________________________________________
IV. The Forward Opportunity — V4, Horizon, and RWAs
Aave’s bullish case rests on a genuine strategic pivot that, if executed well, could be transformative:
Aave V4 debuted on Ethereum, introducing a system that separates lending markets while sharing liquidity, aiming to expand DeFi into real-world assets and institutional use cases. The Hub-and-Spoke model eliminates the liquidity fragmentation that has been Aave’s biggest architectural weakness relative to Morpho. CoinDesk
The Horizon platform, which enables institutions to borrow stablecoins against tokenized real-world assets like U.S. Treasuries, crossed $580 million in net deposits by December 2025, with the 2026 roadmap targeting $1 billion through partnerships with Circle, Ripple, Franklin Templeton, and VanEck — repositioning Aave not just as a DeFi lending protocol but as a gateway connecting on-chain liquidity to the estimated $500 trillion market for traditional financial assets. BYDFi
The SEC clearing Aave in December 2025 is significant regulatory tailwind that competitors like Morpho do not yet have.
________________________________________
Summary Scorecard
Threat / Factor Severity Direction
Governance crisis (revenue diversion) Was 🔴 High ✅ Resolved via AWW vote
Contributor exodus (BGD, ACI, Chaos Labs) 🔴 High ⚠️ Ongoing — talent loss is permanent
Kelp DAO exploit / bad debt 🟡 Medium ⚠️ Recovery ongoing
Morpho competitive pressure 🟡 Medium ↗️ Growing but Aave moat still 4x
AI displacement of core lending 🟢 Low AI needs Aave, not the reverse
AI as demand driver (agent finance) 🟢 Opportunity ↗️ AI agents as future borrowers
RWA / Horizon institutional pivot 🟢 Opportunity 🚧 Execution risk without Chaos Labs
AAVE token value post-AWW 🟢 Improving Revenue now flows to holders
The honest investor framing: AAVE is not a protocol under existential threat from AI or competition. It is a dominant protocol that just went through severe self-inflicted governance damage — and then resolved the governance question while simultaneously losing most of its experienced independent operational talent. The protocol’s fundamentals ($140M revenue, 60%+ market share, V4 launched, Horizon growing) remain strong. The execution risk is now the critical variable, particularly around whether Aave Labs can rebuild risk management infrastructure capable of safely managing the far more complex V4 architecture and institutional RWA markets without the teams that built and operated V3.
You said: In the case of File Coin, I see they have recurring accounts utilizing their service, but are they at risk of disintermediation by AI?
In the case of File Coin, I see they have recurring accounts utilizing their service, but are they at risk of disintermediation by AI?
12:11 PM
Claude responded: This is a genuinely nuanced question, and the answer is more counterintuitive than most analysts present.
This is a genuinely nuanced question, and the answer is more counterintuitive than most analysts present. Let me give you the full picture — because Filecoin’s disintermediation risk is not primarily from AI. It is from a different set of structural forces entirely.
________________________________________
Filecoin: Where the Real Risks Are, and Why AI Is Not the Main One
I. Understanding What Filecoin Actually Sells
Before assessing disintermediation, it’s important to be precise about what Filecoin’s value proposition actually is — because it has evolved significantly. The network was originally positioned as decentralized cold storage (a censorship-resistant Dropbox). That narrative failed to generate meaningful paid demand for years, creating the “subsidized storage” critique where miners were essentially farming block rewards rather than serving real clients.
That picture has shifted materially. Filecoin Onchain Cloud, launched November 18, 2025, expands Filecoin beyond archival storage into a programmable cloud platform offering warm storage, verifiable retrieval, and onchain, proof-gated payments — with early usage reflecting growing demand from more than 100 teams building with FOC. Filecoin
In 2026, the Filecoin community has shifted focus away from growing supply toward scaling demand — converting real-world storage demand into paid, onchain services — and the network already secures critical data for institutions including the Internet Archive, MIT Open Learning, the Smithsonian, and Starling Lab. Medium
The key distinction: Filecoin is no longer just selling storage. It is selling verifiable storage — cryptographic proof that data has not been tampered with, combined with programmable payments and on-chain access control. This matters enormously for the AI displacement question.
________________________________________
II. The AI Disintermediation Question — Answer: AI Is Not a Threat, It’s a Demand Driver
Here is the core insight most analysts miss: AI does not disintermediate Filecoin. AI creates the most compelling use case Filecoin has ever had, for a structural reason that centralized alternatives cannot easily replicate.
The AI Training Data Integrity Problem
AI models trained on poisoned data produce unreliable results — Filecoin’s cryptographic guarantees prevent this attack vector. For AI training where model quality depends critically on data integrity, cryptographic proof that datasets remain unmodified provides value that centralized storage cannot match. MEXC
This is not a minor feature. As AI models increasingly influence healthcare, finance, legal decisions, and public information systems, the question of who can prove that training data was not altered becomes a regulatory and liability question, not just a technical one. AWS S3 can tell you a file exists. It cannot provide a cryptographic, auditable proof that the file is identical to what was originally stored — a guarantee that a court, regulator, or AI audit body might require. Filecoin can.
AI agents using autonomous deals can fetch and update training data without human intervention — and Filecoin’s 2026 strategy zeroes in on high-value verticals like AI pipelines and agents that need persistent, high-integrity storage for critical datasets. Ainvest
Developers are building data DAOs that let communities curate and monetize specialized training sets, with the network’s exbibytes of existing capacity absorbing sudden spikes in demand. Soon, developers will be able to monetize access to valuable datasets, allow AI agents to programmatically pay for information, and create new revenue streams for data producers, all settled transparently on-chain. KuCoin
This creates a genuinely novel economic model: AI agents paying Filecoin storage providers autonomously, on-chain, per retrieval. No centralized cloud offers that.
________________________________________
III. The Real Risks Filecoin Faces — They Are Structural, Not AI-Related
Risk 1: The Utilization Problem Is Not Solved
In Q3 2025, network utilization increased from 32% to 36% despite a 10% decrease in total storage capacity — active storage demand remained stable with only a slight decrease in stored data to 1,110 PiB, and the average daily new transaction volume dropped by 19%. Messari
36% utilization on a network that has spent years building supply is a sobering number. AWS stores exabytes — thousands of PiB — across its S3 and other storage services, orders of magnitude more than Filecoin’s current capacity. Even if Filecoin captured 1% of the cloud storage market, it would represent 10–100x growth from current levels. The network has proven the technology works. It has not yet proven it can generate demand at scale. Messari
Risk 2: The Paid vs. Subsidized Storage Distinction
The persistent challenge is distinguishing genuine paid demand from storage activity subsidized by block rewards. For the token to recover, the network must prove that its active storage scales because clients are actually paying for the service, rather than storage providers subsidizing deals to farm block rewards. The 2026 strategy explicitly acknowledges this — shifting focus from supply bootstrapping to paid on-chain demand — but the proof of concept is still early. MEXC
Risk 3: Decentralized Competitors Are Sharpening
Filecoin’s most credible competitive threat is not AWS — it is other decentralized storage networks targeting similar use cases with different architectural tradeoffs.
Storj differentiates itself with sub-second retrieval times and S3-compatibility out of the box — characteristics that matter for AI inference and active datasets — distributing file shards across more than 24,000 nodes globally, delivering performance closer to centralized object storage while pricing roughly 80% below AWS S3. DePINscan
Arweave occupies the permanent storage niche with its AO compute layer now supporting AI provenance tracking. Each of these protocols has carved out specific segments where performance or pricing undercuts Filecoin’s current offering.
Risk 4: The Latency / Performance Gap vs. Centralized Cloud
Filecoin Onchain Cloud won’t replace AWS in 2026 — but it doesn’t need to. Near-term, FOC is expected to dominate Web3-native infrastructure: NFT storage, blockchain data archival, DAO governance records, and decentralized frontend deployment. The AI data storage opportunity grows as training datasets require verifiable provenance. Enterprise cold storage presents immediate cost arbitrage for archival, backup, and compliance data where retrieval latency matters less than cost savings. KuCoin
This is an honest assessment that identifies where Filecoin is genuinely competitive today versus aspirationally competitive tomorrow. Latency-critical AI inference workloads are not going to Filecoin in 2026 — they are staying on AWS and Google Cloud. The addressable market right now is archival, training data, compliance, and cold storage.
Risk 5: Regulatory Overhang on FIL Token
The SEC has repeatedly cited FIL as a potential unregistered security. While the SEC’s Crypto Task Force launched a series of roundtables in 2026 to discuss clearer rules for digital assets, definitive legal safety has not been established — until FIL is explicitly cleared, U.S. institutional adoption faces friction. This is a headwind that AWS, Google Cloud, and even Storj do not face. WEEX
________________________________________
IV. The Tokenomics Inflection — A Potential Catalyst
One underappreciated dynamic is coming in late 2026 on the supply side. FIL’s circulating supply growth is expected to slow and may turn negative or deflationary by late 2026 — token vesting from early stakeholders including Protocol Labs and the Filecoin Foundation ends in October 2026, removing a major source of new tokens — while demand sinks like collateral locking under FIP-81 and protocol revenue burns under FIP-100 increase. Filecoin: TL;DR
This is a structural change to token supply that has nothing to do with AI or competition — it is a scheduled mechanical shift that could significantly alter the FIL supply/demand equation in late 2026 if demand growth continues.
________________________________________
V. Summary Framework
Risk / Opportunity Type Severity Direction
AI disintermediation of storage Competitive 🟢 Not a threat AI creates demand for Filecoin
AI training data provenance Opportunity 🟢 Strong Structural moat vs. centralized cloud
AWS / Google Cloud competition Competitive 🟡 Medium Performance gap remains for hot data
Storj / Arweave competition Competitive 🟡 Medium Niche fragmentation
Utilization still at 36% Structural 🔴 High Core unresolved challenge
Paid vs. subsidized demand Economic 🔴 High 2026 strategy addresses but unproven
FIL regulatory / SEC status Legal 🟡 Medium Unresolved, U.S. institutional friction
Tokenomics deflection (Oct 2026) Supply 🟢 Potential catalyst Scheduled supply reduction
Filecoin Onchain Cloud (FOC) Strategic 🟢 Promising Too early to quantify
The honest investor framing on Filecoin is this: AI is not the disintermediation threat — it is potentially the best demand catalyst the network has ever encountered. The real risks are operational and economic: converting the world’s largest decentralized storage capacity into a business where clients are paying real money for verifiable data guarantees, at scale, before competitors with simpler architectures and better latency profiles capture the AI storage wallet. The October 2026 vesting cliff is worth watching as a near-term tokenomics event. The 2026 paid demand pivot is the strategic story to track.
You said: Focusing for the moment on the Bitcoin Blockchain, how should an investor look at the token Stacks and its business platform of enabling L2s on the Bitcoin pla…
Focusing for the moment on the Bitcoin Blockchain, how should an investor look at the token Stacks and its business platform of enabling L2s on the Bitcoin platform?
3:36 PM
Claude responded: This is a genuinely complex investment thesis to evaluate — Stacks is one of those rare cases where the fundamental technology story and the token price story …
This is a genuinely complex investment thesis to evaluate — Stacks is one of those rare cases where the fundamental technology story and the token price story are almost entirely disconnected. Let me give you a structured, unvarnished analysis.
________________________________________
Stacks / STX: The Bitcoin L2 Investment Thesis, Fully Examined
I. What Stacks Actually Is — and Why the “L2” Label Is Debated
Before assessing the investment, precision on the architecture matters. Stacks is not an L2 in the same technical sense as Arbitrum or Optimism on Ethereum. It is more accurately a smart contract execution layer that settles its state to Bitcoin, operating via a unique consensus mechanism called Proof-of-Transfer (PoX).
Through PoX, miners transfer BTC to produce blocks, while STX token holders lock their tokens to support consensus and receive BTC rewards — the more miners participating, the more BTC rewards distributed among Stackers. Metadata from newly mined Stacks blocks are anchored to every Bitcoin block, allowing users to verify the canonical Stacks blockchain via Bitcoin. Filecoin
This architecture creates something genuinely novel: a system where Bitcoin holders can earn BTC yield without selling BTC, and where smart contracts inherit Bitcoin’s finality — without modifying Bitcoin itself. That is the core value proposition, and it is architecturally defensible precisely because it requires zero changes to Bitcoin’s base layer.
The Nakamoto upgrade in October 2024 was the inflection point that made this credible at scale: the upgrade cut block times to approximately 5 seconds and gave Stacks 100% Bitcoin finality for transactions, while sBTC launched in December 2024, enabling programmable Bitcoin in DeFi. Filecoin
________________________________________
II. The Current State — Bifurcated Reality
Stacks presents an almost textbook case of fundamental/price divergence, and an investor needs to hold both truths simultaneously:
The Bull Case in the Data:
Stacks published its Q1 2026 report showcasing a peak of $545 million in sBTC TVL, settling at $437 million by quarter’s end. The Bitcoin staking pilot attracted over 320 BTC offering up to 10% APY. Institutional integration deepened with Fireblocks support, Circle’s USDC launch, and Grayscale’s Stacks Trust trading publicly. SwapSpace
Fireblocks announced support for Stacks, expanding potential access to 1,800+ institutional customers for Bitcoin DeFi through the network. Circle’s USDCx went live on Stacks, making it the only Bitcoin L2 in Circle’s xReserve pilot program. BitGo provides institutional custody support for both BTC and sBTC. Grayscale’s Stacks Trust (STCK) began trading on OTCQB in October 2025, becoming the first publicly quoted US investment product offering direct STX exposure. CoinMarketCap
Across five years, Stacks has distributed over 4,000 BTC to participants through its Stacking mechanism — and an upcoming upgrade embeds self-custodial BTC staking directly into PoX, extending rewards to both BTC and STX stackers, giving long-term BTC holders a reason to engage without surrendering custody. Gate Learn
These are not vanity metrics. Fireblocks serving 1,800+ institutional clients, Circle choosing Stacks as its only Bitcoin L2 pilot partner, and Grayscale creating a regulated trust product — these signal that the institutional tier takes Stacks seriously as infrastructure.
The Bear Case in the Data:
STX trades at approximately $0.226, down 63% from its October 2025 peak, with a market cap of $416 million. Daily active addresses fell 38.1% in Q2 2025 despite transaction growth. Developer activity contracted sharply in H1 2025 despite protocol upgrades. The asset presents a bifurcated investment profile: genuine technical innovation and institutional infrastructure development offset by severe price underperformance, adoption challenges, and execution risks. Bitcoin Foundation
STX trades at $0.27 with a 93% drawdown from its all-time high of $3.84. Grayscale’s Stacks Trust trades on OTCQB since October 2025. A 93% drawdown from ATH while the technology is arguably the most mature it has ever been is the central paradox for any STX investor. Coinbureau
________________________________________
III. The Competitive Landscape — This Is the Critical Risk
The Bitcoin L2 space has exploded since Stacks built its first-mover position, and this is where the investment thesis faces its sharpest challenge.
The Bitcoin L2 ecosystem includes eight notable projects heading into mid-2026: Citrea, Spark, Stacks, BOB, Starknet, Lightning, Botanix, and Bitcoin OS — each with different architectural approaches. OKX
The key competitive tensions for Stacks specifically:
vs. Lightning Network: Lightning dominates payment use cases but cannot do smart contracts or DeFi. These are complementary, not competing, for now.
vs. BOB (Build on Bitcoin): BOB takes the most familiar approach for developers coming from Ethereum — built on the OP Stack, it is an optimistic rollup that combines Bitcoin security with full EVM compatibility and a native BTC bridge. Smart contracts deploy exactly as they would on Optimism or Base, but settlement anchors to Bitcoin mainnet. This is the most direct competitive threat to Stacks — it offers the Ethereum developer base a lower switching cost to build on Bitcoin. Gate Learn
vs. Bitlayer and BitVM-based rollups: Citrea launched as the first ZK rollup using BitVM for proof verification in early 2026. GOAT Network actively implements BitVM2 to create trustless bridges where fund withdrawals don’t require federation approval. These next-generation architectures are architecturally more trustless than Stacks’ current sBTC peg, which still relies on a signer set. AMBCrypto
vs. Babylon: Babylon focuses on Bitcoin staking as a security primitive for other chains — a different abstraction layer but competing for the same “activate dormant Bitcoin capital” narrative.
The honest competitive summary from Coin Bureau: Stacks has a narrower pitch — activating Bitcoin capital through sBTC, Clarity, and Bitcoin-linked finality. Stacks is not trying to become Arbitrum on Bitcoin. Its value depends on whether BTC holders want lending, borrowing, yield, and DeFi without fully leaving the Bitcoin ecosystem. Chainwire
________________________________________
IV. The STX Token — The Structural Problem Investors Must Understand
This is the most important analytical point that is frequently glossed over in Stacks promotion. The value of sBTC’s success does not automatically flow to STX holders. Understanding this disconnect is critical.
When BTC is locked as sBTC and deployed in Zest, Hermetica, or Bitflow — those transactions generate activity and value. But the fees on that activity accrue to the Stacks network, not directly proportional to STX price. STX is the native token used for transaction fees, smart contract execution, mining incentives, and Stacking — tied to Stacks usage, but not a direct Bitcoin proxy. A stronger ecosystem can support token demand, but price still depends on emissions, liquidity, competition, market cycles, and value capture. Coinbureau
The critical issue: STX inflation. The emissions plan introduces modest inflation averaging 5.75% annually, with optional token burns if targets are exceeded. In an environment where the token is already down 93% from ATH and daily active addresses are declining, consistent 5.75% annual dilution creates a persistent headwind against price recovery. The token burns are optional and target-dependent — not a structural supply constraint like Bitcoin’s halving. Filecoin
Coinbase’s decision to delist STX perpetual futures in April 2026 as part of a “quality review” is a sobering signal about market liquidity perception, even as the fundamentals were strengthening.
________________________________________
V. The Clarity Language Moat — Double-Edged Sword
Clarity gives Stacks a security-first edge — it is designed for predictable smart contract execution — but it also asks developers to learn a smaller ecosystem. The trade-off is adoption: Solidity has a much larger developer base and deeper tooling. Chainwire
For investors this is a classic network effects tension. Clarity’s security properties are genuinely superior for financial applications — it is non-Turing-complete by design, meaning you can mathematically verify what a contract will do before deploying it. That matters enormously for institutional DeFi where smart contract exploits carry legal and reputational consequences. But if developers default to EVM-compatible chains because Solidity expertise is ubiquitous, Clarity’s safety advantages may not be sufficient to drive adoption velocity.
________________________________________
VI. Investment Framework: How to Think About STX
Dimension Assessment Signal to Watch
Technology moat 🟢 Genuine — only Bitcoin-native smart contracts with BTC finality Satoshi Upgrades execution
sBTC adoption 🟢 $437M TVL, growing institutional engagement Fireblocks institutional BTC inflows
Competitive pressure 🔴 High — BOB, Citrea, Babylon all credible Which L2 captures next $1B of BTC TVL
STX token value capture 🟡 Weak link — ecosystem growth ≠ STX price Fee burn mechanisms, emissions trajectory
Developer growth 🟡 Growing but smaller than EVM chains Electric Capital annual report
Institutional readiness 🟢 Strong — Fireblocks, BitGo, Circle, Grayscale Actual capital deployment, not just integrations
Inflation / dilution 🔴 5.75% annual — headwind at current price Token burn activation against targets
Regulatory standing 🟢 2019 SEC-qualified offering provides precedent No current enforcement risk
Price vs. fundamentals 🔴 93% from ATH despite strong tech milestones sBTC TVL growth as leading indicator
AI threat 🟢 Very low — Stacks benefits from AI agent finance AI agents need Bitcoin DeFi rails
________________________________________
VII. The Investor Bottom Line
Stacks is best understood as a long-duration infrastructure bet on two compounding theses: that Bitcoin will become a productive asset rather than just a store of value, and that Stacks will remain the dominant layer where that productivity happens. Both theses are coherent. Neither is guaranteed.
The near-term catalysts that matter most are not the institutional partnership announcements — those have already been priced in and the token still declined. The variables that will actually move STX are: whether Fireblocks’ 1,800+ institutional clients actually deploy BTC capital into Stacks DeFi in meaningful size, whether the Satoshi Upgrades deliver the sBTC security improvements that close the trust gap versus BitVM-based competitors, and whether the protocol can implement meaningful STX fee burn mechanisms that turn the 5.75% inflation from headwind to neutral.
The bear case is not that the technology fails. It is that Bitcoin DeFi becomes a fragmented market across 6–8 competing L2s with no dominant winner, sBTC TVL plateaus below $1 billion, and STX token holders continue experiencing inflation dilution without commensurate usage-driven demand. At a $400 million market cap and 93% drawdown from ATH, that risk is at least partially priced in — but “cheap relative to ATH” is not the same as “attractively valued at current fundamentals.”
You said: Ok, now let’s switch to telecommunications and information pathways.
Ok, now let’s switch to telecommunications and information pathways. Helium (HNT) created interest as a long-distance cost alternative to cell broadband infrastructure and for the IOT future potential. Where are they now?
1:11 AM
Claude responded: Helium is one of the most fascinating case studies in the entire DePIN sector — because it is simultaneously one of the few crypto projects with verifiable, re…
Helium is one of the most fascinating case studies in the entire DePIN sector — because it is simultaneously one of the few crypto projects with verifiable, recurring commercial revenue from traditional industry partners, and a token that has returned almost nothing to investors who bought at peak valuations. Let me give you the complete picture.
________________________________________
Helium (HNT): The Full Investor Analysis
I. Where They Actually Are Now — The Bifurcated Story
Helium’s situation mirrors a pattern you’ve now seen across this entire conversation: the network is genuinely growing, while the token is not reflecting that growth. Understanding why requires separating three distinct layers — the IoT network, the Mobile network, and the HNT token economy.
The Network Fundamentals Are Real:
January 2026 was a notable milestone: the Helium Network generated $24 million in revenue — a figure that puts it among the small number of crypto projects with genuine, recurring commercial income rather than speculative token inflows. The revenue stems from two sources: enterprise data credits purchased by companies using the IoT network for logistics, agriculture, and smart city applications; and carrier offload payments from telco partners routing mobile traffic through Helium’s 5G small cell network. CoinMarketCap
By Q2 2025, the Helium Network had transferred over 2,721 TB of data offloaded from major U.S. mobile carriers — a 138.5% increase quarter over quarter — and over 311,200 accounts had signed up to Helium Mobile, a 94.1% QoQ increase. The SEC also dismissed its lawsuit against Helium with prejudice in April 2025, establishing that HNT, MOBILE, and IOT tokens are not considered securities. CoinMarketCap
That SEC dismissal with prejudice is significant — it is not a settlement or a consent decree. It is a full legal clearance that now sets precedent for the broader DePIN sector and removed a major overhang that had suppressed institutional interest.
The Carrier Partnerships Are the Strategic Core:
AT&T and Telefónica using the Helium network for mobile offload represents a fundamentally different category of adoption than most crypto partnerships — it means recurring B2B revenue from entities with hundreds of millions of customers. On the IoT side, enterprise users include logistics companies deploying asset trackers, smart agriculture operators monitoring soil and weather sensors, and urban infrastructure projects tracking air quality and parking availability. Messari
This is genuinely important for an investor with your lens. Carrier offload is not a speculative partnership announcement — it is a contractual, recurring revenue relationship where AT&T routes its subscribers’ mobile data through Helium hotspots rather than building new cell infrastructure in dense urban areas. That is a structural cost-reduction mechanism for one of the largest telecoms in the world, which is a very different category of validation than a token integration.
The Token Price Tells a Different Story:
Current prices around $0.93 reflect broader altcoin weakness — HNT’s market cap of $173 million remains a fraction of its 2021 peak. The token has lost the vast majority of its value from the peak when the hotspot gold rush narrative was at its height, even as the underlying network has grown into a genuine commercial business. Messari
________________________________________
II. The Tokenomics Transformation — The Most Important Structural Change
Helium has undergone the most significant tokenomics redesign of any major DePIN project. Understanding it is essential for any investment thesis.
The August 2025 Halving:
The third Helium halving on August 1, 2025 cut annual HNT issuance from 15 million to 7.5 million. Critically, data transfer rewards remained unaffected by the halving — Mobile Hotspot owners are compensated for utility they provide by offloading data to the network at roughly the same USD value per gigabyte as before the halving. This design is important: it separates inflationary coverage subsidies (which halved) from utility-based rewards (which are protected). The network is deliberately transitioning from “pay people to build coverage” to “pay people for coverage that is actually used.” CoinMarketCap
The Burn Experiment:
Beginning in August 2025, Helium Mobile routed 100% of its subscriber revenue to HNT purchases in the open market, which were then burned to create Data Credits — with the goal of gauging whether predictable purchases, in tandem with reduced emissions, would translate to more accurate ties between network usage and token value. In Q4, the experiment produced $2.9 million in discretionary burns, equivalent to $31,765 in DC burns per day. This resulted in DC burn exceeding HNT emissions for the first time — meaning the network achieved net deflation. Messari
Net deflation achieved for the first time in the network’s history is a meaningful milestone. However, on January 2, 2026, CEO Amir Haleem suspended the experiment to focus on user growth and carrier offload rather than discretionary burn. This pivot — choosing growth over token price support — is a rational strategic decision but tells you something important about management priorities: they are building a telecommunications business, not a token price appreciation scheme. For some investors that is reassuring; for HNT token speculators, it is a headwind. Messari
________________________________________
III. The Hotspot Operator Reality — The Supply Side Problem
The hotspot operator experience is where the original Helium investment narrative has most clearly disappointed. The economics have fundamentally shifted since 2021.
During Helium’s rapid expansion phase, hotspot numbers surged — but by late 2023, many early adopters exited as rewards became diluted. Active hotspots stabilized around 350,000–370,000 in early 2025 — a measured count reflecting Helium’s deliberate shift from sheer quantity to high-quality, useful coverage. Phemex
For most people running an IoT hotspot, earnings are now cents, not dollars, per day. Urban centers suffer from over-saturation where too many hotspots compete for limited rewards — though hotspots in semi-urban or rural areas with growing IoT adoption but fewer miners can provide higher ROI. CoinMarketCap
This dilution of hotspot rewards is a structural feature, not a bug — the network was always designed to reduce speculative mining rewards as genuine data usage replaced them. But the transition period has been brutal for operators who bought hardware expecting the 2021-era return profile. The Helium Foundation’s $50 million grant program for strategic hotspot deployment in high-demand urban zones is the network’s response — effectively acknowledging that organic economic incentives alone are no longer sufficient to drive optimal coverage deployment.
________________________________________
IV. The IoT Future — Is the Original Promise Delivering?
The original Helium pitch was that LoRaWAN connectivity for IoT devices would be the killer use case — cheap, long-range, low-power data transmission for billions of sensors. The reality in 2026 is more nuanced.
IoT remains a live part of the network. Notable enterprise IoT uses include flood detection in Portugal and monitoring humidity and temperature in museums — alongside logistics asset tracking, smart agriculture, and urban smart city applications. But IoT has been overshadowed as the flagship revenue driver by Mobile carrier offload, which generates more revenue per unit of data transferred. Crypto Economy
The IoT thesis is also facing a structural competitive challenge not directly related to AI: Starlink’s direct-to-device satellite connectivity, combined with the proliferation of NB-IoT and LTE-M cellular standards built into modern IoT chips, means the competitive landscape for low-power wide-area connectivity has become far more crowded than it was in 2019 when Helium launched.
________________________________________
V. Is AI a Threat or an Opportunity for Helium?
Unlike AAVE or Filecoin, AI’s relationship with Helium is mostly indirect — but there are meaningful dimensions on both sides:
AI as a Demand Driver: The explosion of AI-powered edge computing, autonomous vehicles, smart city sensor networks, and industrial IoT applications all generate more data that needs transmission infrastructure. Helium’s low-power IoT network is a natural fit for the sensor layer of AI-driven physical infrastructure. As AI makes edge devices more capable and more numerous, the volume of small-data-packet transmissions that LoRaWAN handles efficiently should grow.
AI as a Competitive Threat: AI-driven network optimization is allowing traditional carriers to deploy coverage more efficiently, reducing the cost advantage that community-built infrastructure once held. As AT&T and T-Mobile use AI to dynamically manage their small cell deployments, the gap between centralized and decentralized infrastructure cost economics narrows. This is a slow-burning competitive pressure rather than an existential threat.
AI as an Operational Tool: Helium’s Proof-of-Coverage mechanism — the cryptographic system that verifies hotspots are actually where they claim to be — is increasingly using AI-enhanced anomaly detection to identify gaming and fraudulent coverage claims, which was a significant problem in the early network. This is AI strengthening Helium’s operational integrity.
________________________________________
VI. The Structural Investment Framework
Dimension Assessment Direction
Carrier offload revenue (AT&T, Telefónica) 🟢 Genuine commercial validation ↗️ Growing — 138% QoQ in Q2 2025
SEC clearance (dismissed with prejudice) 🟢 Major regulatory tailwind ✅ Resolved
Mobile subscriber growth 🟢 3.5M+ subscribers, growing ↗️ Consistent QoQ growth
August 2025 halving (supply cut 50%) 🟢 Structural supply reduction ✅ Completed
Net deflation achieved 🟢 First in network history ⚠️ Experiment suspended for growth focus
HNT token price vs. fundamentals 🔴 $0.93, down ~90% from ATH ↘️ Declining trend
Hotspot operator economics 🔴 Cents/day for most IoT operators ↘️ Structurally declining without data usage
IoT competitive landscape 🟡 Starlink, NB-IoT encroaching ↘️ Narrowing moat
Grayscale watchlist inclusion 🟡 Research interest, not commitment → Neutral near-term
AI demand for IoT data layer 🟢 Structural tailwind ↗️ Growing edge compute demand
________________________________________
VII. The Investor Bottom Line
Helium is the rare crypto project that has successfully made the transition from speculative narrative to recurring commercial revenue — but has done so in a way that has not yet translated into HNT token value recovery. At a $173 million market cap against $24 million in monthly revenue (January 2026), the revenue multiple looks superficially cheap. But the key questions are: how much of that January revenue is recurring vs. one-time, what is the margin structure after hotspot operator rewards are paid out, and whether carrier offload relationships deepen meaningfully into contractual volume commitments rather than opportunistic traffic routing.
The most honest framing: Helium has survived its existential challenges — SEC clearance, the hotspot oversupply correction, the blockchain migration — and emerged as a functioning decentralized telecom business with real enterprise clients. What it has not yet demonstrated is that the HNT token is the right investment vehicle for capturing that value, given that management has explicitly prioritized user growth over token price support. For a futurist investor with a 5–7 year horizon, the IoT + AI edge computing thesis makes Helium worth holding. For an investor seeking near-term token appreciation, the technicals and management priorities suggest patience is required before a catalyst large enough to re-rate HNT against its operating fundamentals materializes.
You said: In the world of L1s, HBAR appears to have taken a different approach that has found favor with institutions.
In the world of L1s, HBAR appears to have taken a different approach that has found favor with institutions. Why is this the case, and is the momentum forward positive enough to give this platform long-term sustainability?
4:46 PM
Claude responded: Hedera is perhaps the most intellectually honest “institutional L1” case study in the entire crypto landscape — because the gap between what the network has ac…
Hedera is perhaps the most intellectually honest “institutional L1” case study in the entire crypto landscape — because the gap between what the network has achieved and what the token has returned is wider, and more analytically interesting, than almost any other project we’ve discussed. Let me give you the full picture.
________________________________________
Hedera (HBAR): The Institutional L1 — Why Institutions Choose It and Whether the Thesis Holds
I. The Foundational Answer: Why Institutions Choose Hedera Over Alternatives
The institutional preference for Hedera is not primarily about token economics or DeFi yield — it is rooted in five specific technical and structural properties that distinguish it from every traditional blockchain:
1. The Hashgraph Architecture — Not a Blockchain
This is the starting point that most analysts gloss over. Hedera is not a blockchain. Rather than a chain of blocks, Hedera uses a Directed Acyclic Graph (DAG) — a web-like structure that allows parallel processing. In a blockchain, competing blocks get discarded and the work that went into them is wasted. In Hedera’s hashgraph, every event is preserved and incorporated into a single consensus order. The result is no forks, no mining, and deterministic finality — confirmed transactions stay confirmed. CoinStats
For an institution — a bank, a government registry, an airline — no forks and deterministic finality are not abstract technical preferences. They are legal and operational requirements. A bank cannot explain to its regulators that a settlement might be “probabilistically final” — the 6-confirmation Bitcoin model or Ethereum’s finality window is simply not compatible with how regulated financial systems operate. Hedera’s finality in 3–5 seconds is legally final. That distinction changes the entire risk calculus for institutional deployment.
2. Performance That Matches Enterprise Scale
Hedera processes over 10,000 transactions per second with finality under five seconds and fees fixed at $0.0001 per transaction and $0.001 per smart contract call — set by the governing council rather than fluctuating gas markets. mexc
Fee predictability is as important to institutions as fee level. A corporate treasury cannot model the cost of operating on Ethereum when gas fees can spike 100x during network congestion. Hedera’s council-set, stable fee structure enables enterprises to build cost models, budget infrastructure spend, and sign contracts with clients — things that are impossible when fees are algorithmically volatile.
3. The aBFT Security Standard
Hedera provides asynchronous Byzantine Fault Tolerance (aBFT) — the highest theoretical security standard for distributed systems — meaning Hedera can reach correct consensus even if some nodes are acting maliciously or go offline. This matters to institutions because it means the security guarantee is mathematically provable, not dependent on economic incentive alignment assumptions. Ethereum’s security relies on validators having rational economic incentives — a model that is robust but not mathematically certain. aBFT’s security is guaranteed regardless of adversarial behavior up to a defined threshold.
4. The Governing Council — Structured Accountability That Regulators Understand
This is Hedera’s most controversial feature in the crypto community and its most valued feature in the institutional community — and understanding that tension is essential for any investor analysis.
Hedera is governed by a rotating council of global organizations including Google, IBM, Deutsche Telekom, Boeing, and FedEx — each running nodes and voting equally on decisions, with a maximum of 39 members from diverse industries. In 2026, FedEx joined the Governing Council pushing the roster to 31 members, McLaren Racing joined as a full council member with equal voting rights, and NVIDIA joined through the HEAT developer acceleration program, contributing GPU-accelerated tooling for AI data provenance applications. WithTap
When a bank’s board asks “who is accountable for this infrastructure?”, the answer “the Hedera Council — which includes Google, IBM, and Deutsche Telekom” is dramatically more satisfying than “anonymous validators incentivized by token economics.” Regulators, auditors, and C-suites understand corporate governance. They do not understand token-based consensus incentive design.
5. ESG Compliance — Carbon-Negative Operations
Hedera consumes 0.00025 kWh per transaction — far below Ethereum at 2.95 kWh or Bitcoin at 1,087 kWh — and is carbon-negative, meaning it offsets more than its total emissions. As ESG mandates become board-level requirements at global corporations, the energy consumption of the infrastructure they deploy on becomes a governance question, not just a technical one. Hedera’s energy profile is orders of magnitude better than any proof-of-work alternative.
________________________________________
II. The 2025 Institutional Partnership Record — Genuinely Unusual
The depth and breadth of Hedera’s 2025 institutional engagements is worth examining carefully, because they span sovereign, regulated financial, and enterprise categories simultaneously — something no other L1 has achieved at the same density:
Sovereign and Government: Georgia’s Ministry of Justice plans to migrate its national real estate registry to Hedera’s network, mirroring Dubai’s tokenization initiatives. The Bank of Ghana tested a CBDC pilot with EMTECH on Hedera. Australia shortlisted Hedera for Project Acacia, while the AUDD stablecoin launched on the network. Ainvest
Regulated Finance: In 2025, Hedera facilitated a UK-first use case where tokenized units of a money market fund and gilts were used as collateral in FX trades between Lloyds Banking Group and Aberdeen — the first such transaction in UK financial history. Shinhan Bank and SCB TechX piloted stablecoin remittances on the platform, while Byzanlink in the UAE selected Hedera as the foundational infrastructure for over $100 million in tokenized instruments. Truist Bank partnered through Dropp for micropayment infrastructure. Coinbureau
AI and Technology: ServiceNow is building AI governance tools on the network. NVIDIA joined through the HEAT developer acceleration program. Hedera launched its AI Agent Lab on March 27, 2026 — a no-code platform for building on-chain AI agents, integrated with frameworks like LangChain, enabling AI agents to perform automated token swaps, lending, borrowing, and stablecoin creation directly on-chain. WithTap
The AI Agent Lab integration is particularly significant for your analytical framework: Hedera is explicitly positioning the hashgraph as the verifiable data provenance layer for AI systems — using aBFT consensus to create tamper-resistant audit trails for AI decision-making. This is the same structural argument we saw for Filecoin, applied to Hedera’s transaction ledger. When AI systems make consequential decisions — in finance, healthcare, legal — regulators will eventually demand a verifiable audit trail. Hedera’s architecture is built for exactly that requirement.
________________________________________
III. The Regulatory Breakthrough — Commodity Classification
The SEC and CFTC jointly classified HBAR as a digital commodity in 2026, clearing the path for broader regulated access. The Canary HBAR ETF (ticker HBR) began trading on Nasdaq on October 28, 2025, making HBAR the third cryptocurrency to achieve spot ETF status in the US — with cumulative net inflows reaching $93.21 million by early 2026. Fifteen additional ETF filings are currently under SEC review, including applications from Grayscale and Bitwise. BYDFi
Commodity classification is structurally significant beyond just the ETF. It means HBAR can be held by regulated financial institutions, used as collateral in repo markets, and included in ETF portfolios — pathways that remain closed to assets with unresolved regulatory status. Hedera also joined the Digital Monetary Institute in early 2026 — a policy forum with central banks — which is a signal of where it sits in the global institutional conversation about digital money infrastructure.
________________________________________
IV. The Central Tension: Network Success vs. Token Value Capture
Here is the most important analytical insight for any HBAR investor, stated plainly: Hedera has the most impressive institutional partnership record of any L1 — and a token that is down 83% from its all-time high and currently trading below $0.10.
The network has processed over $10 billion in real-world asset settlements, has over 70 billion lifetime transactions, and has accumulated institutional validation that most crypto projects only dream about. HBAR trades at roughly $0.097 — approximately 83% below its 2021 all-time high. Phemex
The core problem is structural: Hedera’s institutional clients use the network, but they do not necessarily drive HBAR demand in proportion to network usage. When Lloyds and Aberdeen execute tokenized collateral trades on Hedera, the transaction fees are tiny fractions of a cent. The volumes are large but the per-transaction fee capture is minimal. Unlike a DeFi protocol where protocol fees flow to token holders, Hedera’s fee structure — deliberately designed to be cheap enough for enterprise use — creates a value accrual gap between network utility and token appreciation.
The central fundamental weakness is that network usage does not automatically translate into HBAR demand. The bear case is credible because the market has repeatedly demanded proof of organic usage, and Hedera has not yet shown that its institutional positioning reliably converts into token value capture. BanklessTimes
The Token Unlock Problem Is Imminent:
Over 3.7 billion tokens are scheduled for unlock this quarter, increasing total tokens in circulation to over 46 billion out of a maximum supply of 50 billion — expected to be one of the largest unlocks ever — with ETF inflows having slowed substantially to just $2.3 million in a recent month against $53.9 million total net assets. CoinMarketCap
The supply unlock dynamic — combined with slowing ETF inflows — creates a near-term headwind that is mechanical and largely independent of fundamental performance.
________________________________________
V. Centralization — The Philosophical Risk That Won’t Go Away
The Council model that institutions love is the same feature the crypto-native community distrusts most deeply. While 34 global enterprises govern Hedera, the community continues to feel that governance power should rest with holders rather than enterprises and corporations. Mytokencap
This matters for long-term sustainability in a specific way: developer ecosystem growth. The most talented blockchain developers gravitate toward decentralized, permissionless systems where they can build without institutional gatekeeping. Ethereum’s developer ecosystem is an order of magnitude larger than Hedera’s precisely because anyone can build anything without permission. Hedera’s tiered partnership program — Strategic Partners for enterprises and Community Partners for builders — is an attempt to thread this needle, but the hashgraph algorithm’s patent (held by Hedera) remains a philosophical barrier for open-source developer communities. The trade-off is crystal-clear: Hedera prioritizes corporate trust, performance, and regulatory clarity, while accepting criticism that it may sacrifice some degree of decentralization. mexc
________________________________________
VI. Long-Term Sustainability Assessment
Dimension Assessment Direction
Technical architecture for institutions 🟢 Genuinely superior — aBFT, DAG, deterministic finality ✅ Durable moat
Governing Council composition 🟢 Google, IBM, FedEx, McLaren, NVIDIA ↗️ Growing — 31 members
Regulatory status (commodity classification) 🟢 Major milestone — SEC/CFTC cleared ✅ Resolved
Spot ETF on Nasdaq 🟢 Third crypto to achieve this ⚠️ Inflows slowing
Sovereign/government deployments 🟢 Georgia, Ghana, Australia, UAE ↗️ Growing
AI Agent Lab / NVIDIA partnership 🟢 Positions Hedera as AI provenance layer 🚧 Early stage
Token value capture vs. network usage 🔴 Structural gap — cheap fees don’t drive HBAR demand ↘️ Not improving
Supply unlock (3.7B tokens this quarter) 🔴 Largest ever unlock pending ↘️ Near-term headwind
Developer ecosystem vs. Ethereum/Solana 🟡 Significantly smaller → Slowly growing
Decentralization criticism 🟡 Persistent philosophical objection → Unresolved by design
HBAR token price vs. fundamentals 🔴 Down 83% from ATH at $0.097 ↘️ Below all key moving averages
________________________________________
VII. The Investor Bottom Line
Hedera is the clearest example in this entire series of what you might call the “institutional L1 paradox”: a network that is genuinely well-designed for enterprise and government adoption, that has executed on that strategy with remarkable consistency, but whose token has not figured out how to convert institutional network activity into token holder value.
The long-term sustainability question has two separate answers depending on what you mean. For the network: sustainability is high — council members like Google, IBM, and FedEx have organizational incentives to continue running nodes and deploying use cases on infrastructure they collectively govern and have reputational stakes in. The network is not going away. For the HBAR token as an investment: sustainability depends entirely on whether Hedera can close the value accrual gap — demonstrating that the volume and complexity of transactions on the network create enough HBAR-denominated fee demand to absorb the remaining supply unlocks and create genuine scarcity. That bridge has not yet been built convincingly.
For a futurist investor, Hedera is best understood as a long-duration infrastructure position in the regulated digital economy — where the payoff comes not when a DeFi cycle peaks, but when governments migrate national registries, when banks settle tokenized securities at scale, and when AI systems require verifiable audit trails that regulators mandate be stored on tamper-resistant ledgers. On that multi-year horizon, Hedera’s positioning is among the strongest in the sector. On a 12-month token price horizon, the supply unlock, slowing ETF inflows, and value accrual gap make it a challenging hold.