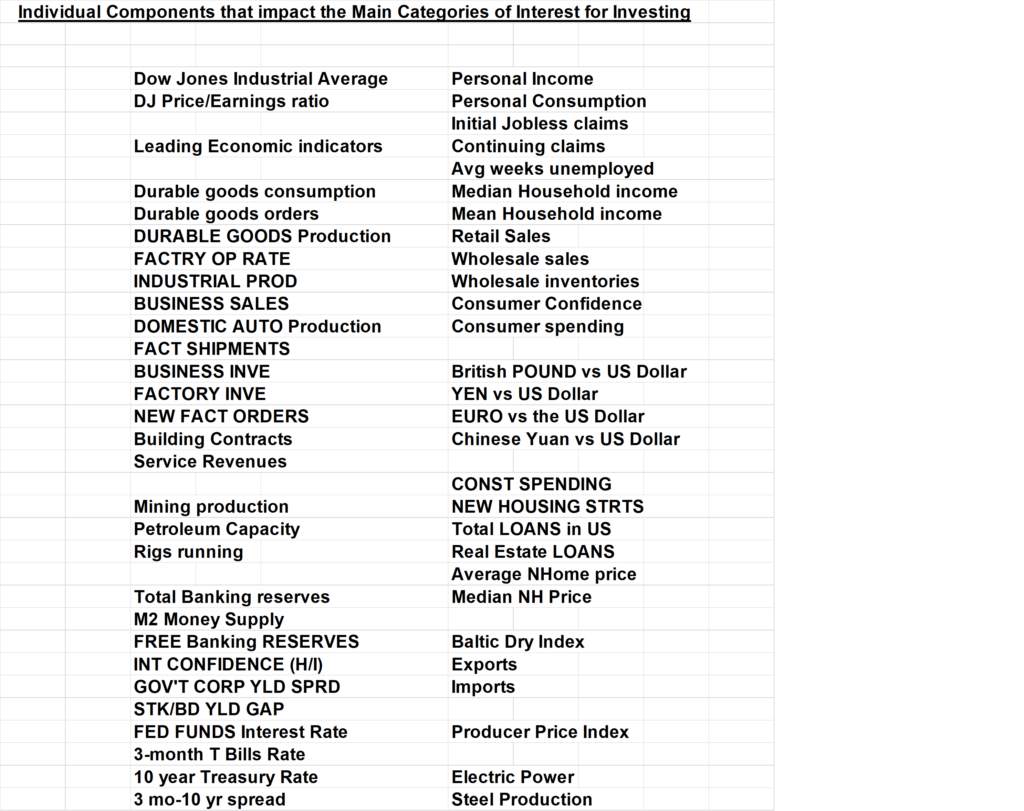
Dating back to 1990 I have maintained a Database of what I believe are the most important elements of the categories referred to in the title of this Post. I measure changes by year on a quarterly basis, but update this each week for new data releases. The summarized measures are reflected below, and they show positive changes in Interest rates, Money, and the Equity market, and negative changes in the economy and in Foreign Exchange.
I will be adding to this post during the next week, offering more detail of the underlying components of the main categories. I will additionally be posting my opinions and views on what this may mean in the context of the pandemic we are all facing. Stay home and be well.
One of the measures I look at is the day-to-day DJIA Index change vs the price change of the 187 Portfolio. The message here is positive as the magnitude of the 187 Portfolio change on down days is shrinking as compared to the magnitude of the change in the DJIA Index, and up days show a greater gain in the portfolio than the decline on down days. This reflects underlying currents that are potentially pointing to future positive strength as buyers are picking up/buying strong equities that have declined in a weak market. Consider the data below:
From March 16, 2020 the degree of decline on down days is less impactful than the days where we have market gains.
Consider the following:
DJIA point change on March 17, 2020 is an increase of 1,049 points. For the 187 Stock Portfolio, the dollar value of change was positive $1,100.76, or $1.12 per DJIA point change.
On March 18, 2020 the DJIA declined by 1,338 points. The 187 Portfolio dollar change was negative $996.91 or $0.75 per DJIA point change. Note the lower change of the 187 portfolio per DJIA point change between March 18 and March 17.
On March 19, 2020 the DJIA increased by 188 points. The 187 Portfolio dollar change was positive $375.85 or $2.00 per DJIA point change. Note the greater change of the 187 portfolio per DJIA point change between March 19 and March 17.
On March 20, 2020 the DJIA declined by 913 points. The 187 Portfolio dollar change was negative $712.37 or $0.78 per DJIA point change. Note the lower change of the 187 portfolio per DJIA point change between March 20 and March 17.
On March 23, 2020 as of 11:45 AM the DJIA declined by 950 points. The 187 Portfolio dollar change was negative $589.06 or $0.62 per DJIA point change. Note the lower change of the 187 portfolio per DJIA point change between March 23 and March 20.
Tom Connolly’s Laboratory of U.S. data
These metrics show where there are positive and negative changes in key market moving segments of our economy.

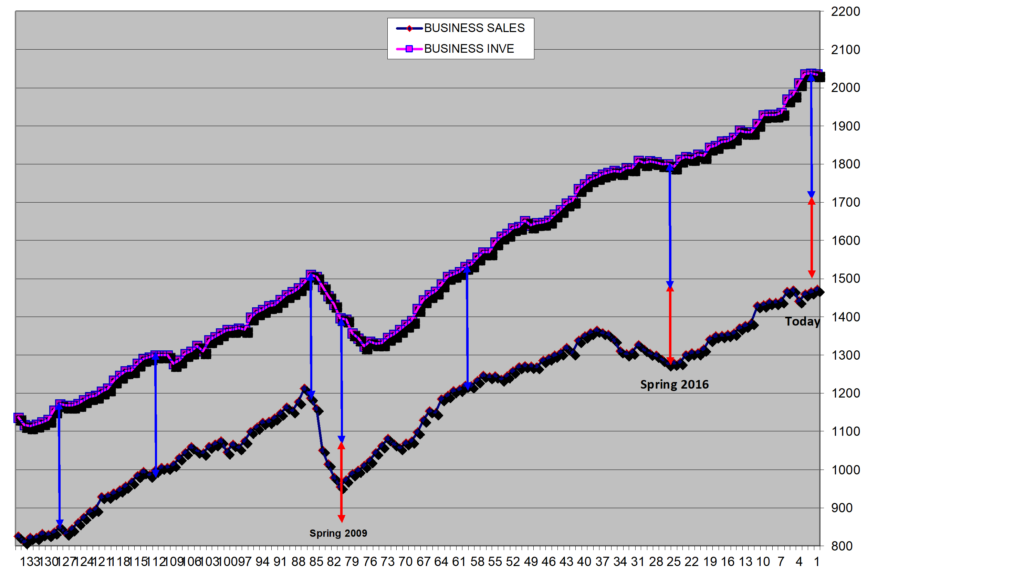
Business Sales as compared to Business Inventory
often lets us know when there is excess supply in the market. Excess supply is always present to a degree, but the current levels indicate a greater buffer zone that may accommodate impulse buys, unanticipated demand, or serve as a precursor to a slow-down in the economy. The chart below shows we have on an historical basis more inventory vs sales. This may, in our current shutdown environment, offer comfort that enough supply is there to meet demand at a time when factories are forced to be idle. Note the Blue and Red arrows. The Blue represents the normal gap between sales and inventory. The Red reveals the level of excess supply.
Business Sales v Inventory
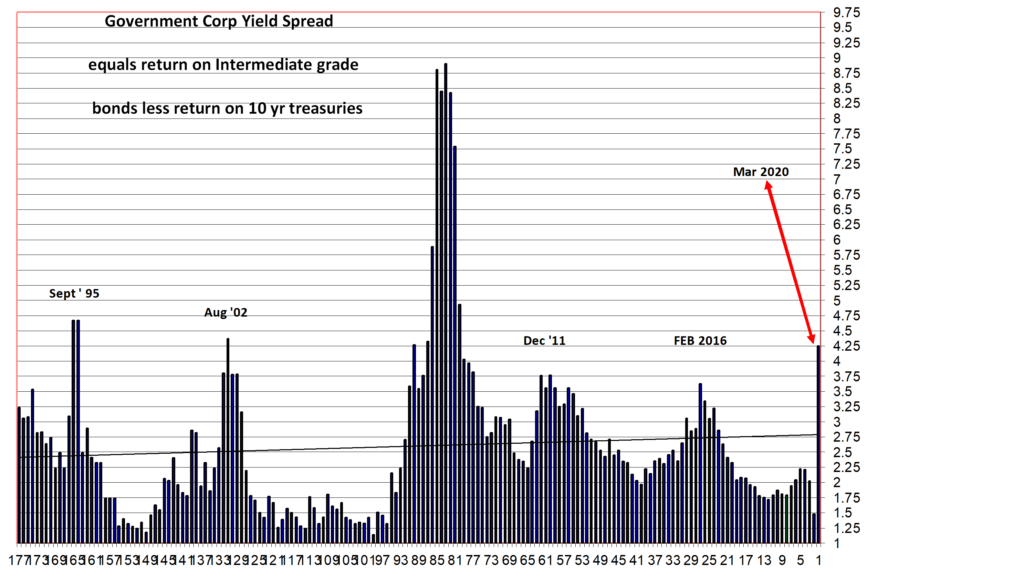
Different interest rates on corporate debt vs government debt
will often give us insight into how much risk there is in the market for loan defaults and economic difficulty to secure new financing. The chart below measures the spread or difference between the 10 year treasury bond and intermediate rated corporate debt. The peaks are all representative of periods when there was greater than normal risk in the market. As you can see, we have now exceeded or approximate the spreads for all past periods of great uncertainty other than the 2008-2009 financial crisis.
Government Corporate Yield Spread
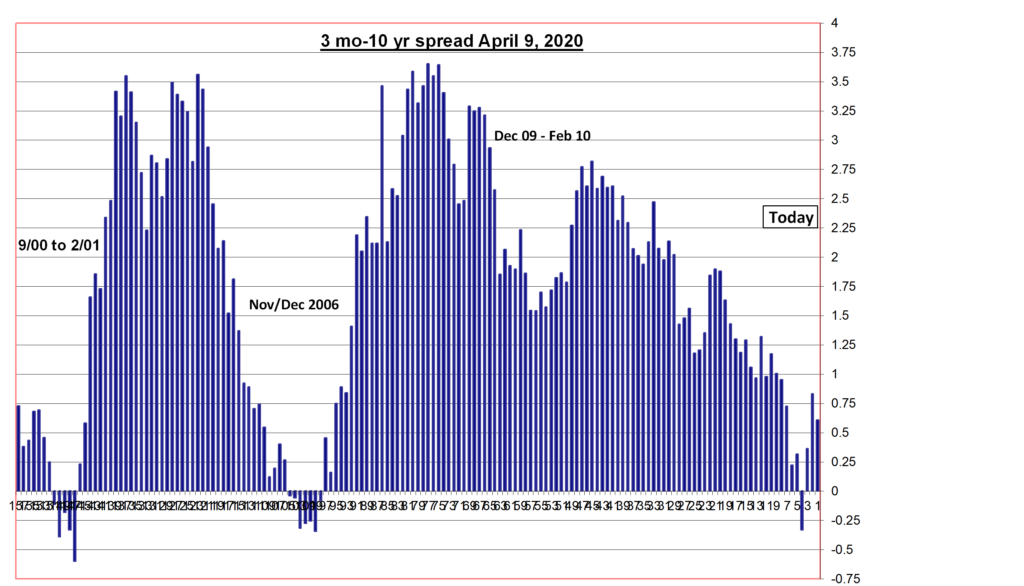
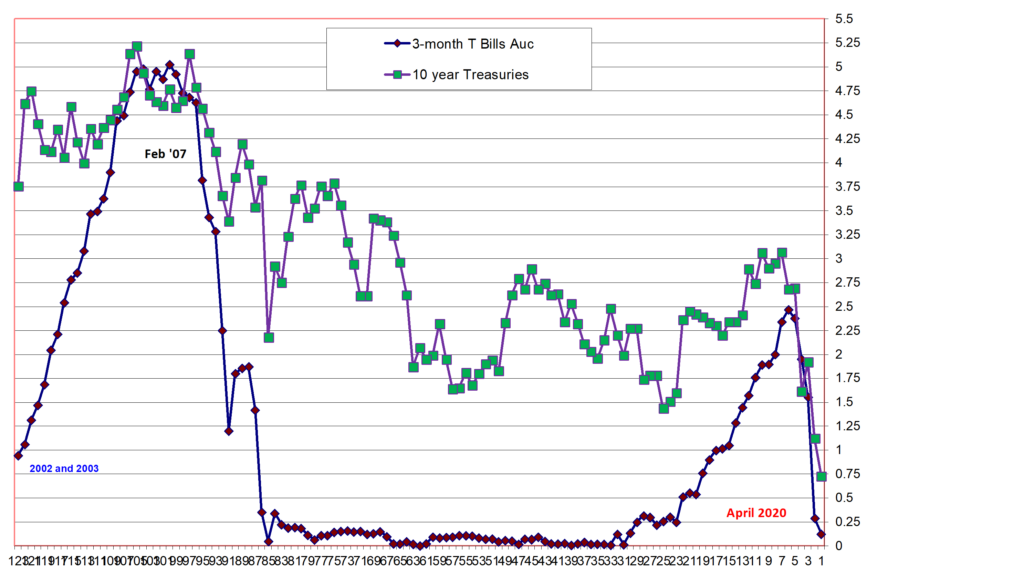
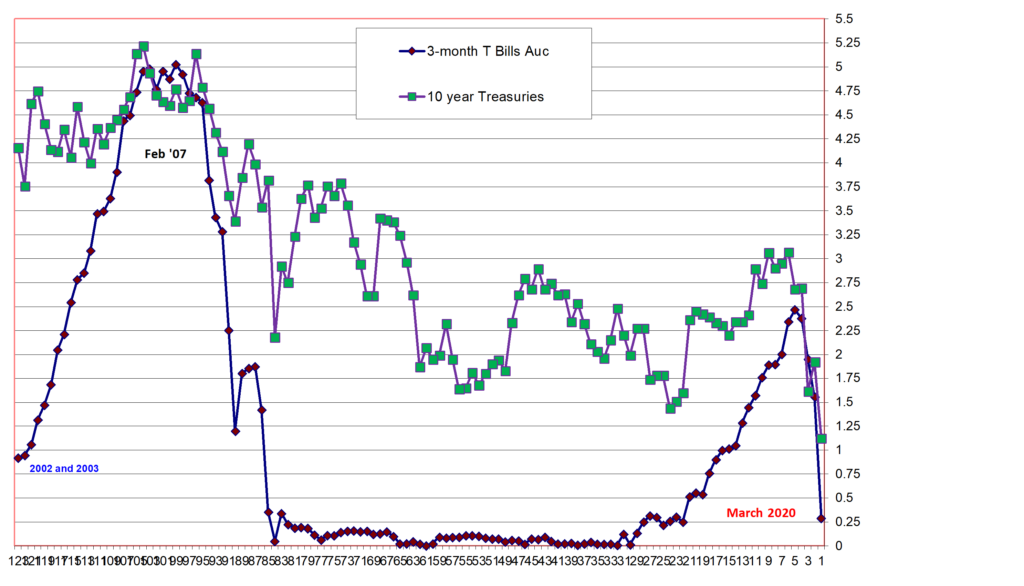
Interest rates on Three-month T-Bills vs 10 Year Treasury securities
over time give a view of monetary policy by the government and market demand for long-term fixed income securities. The chart below shows the dramatic change in yields this past week as the government takes action to provide the market with short-term liquidity at near zero cost, while also serving as a buyer of longer-term maturities. Compare the rates today to the rates that emerged during the 2008/09 financial crisis. Clearly the government agencies are doing everything possible to calm the markets during this unprecedented global health crisis.
3-month vs 10 year government securities
Two of the questions that I am sure are out there are: (1)why did I sell all of my equities at the end of 2019?; and (2) why did I start buying equities this week in the midst of the overall market selling in reaction to the health crisis?
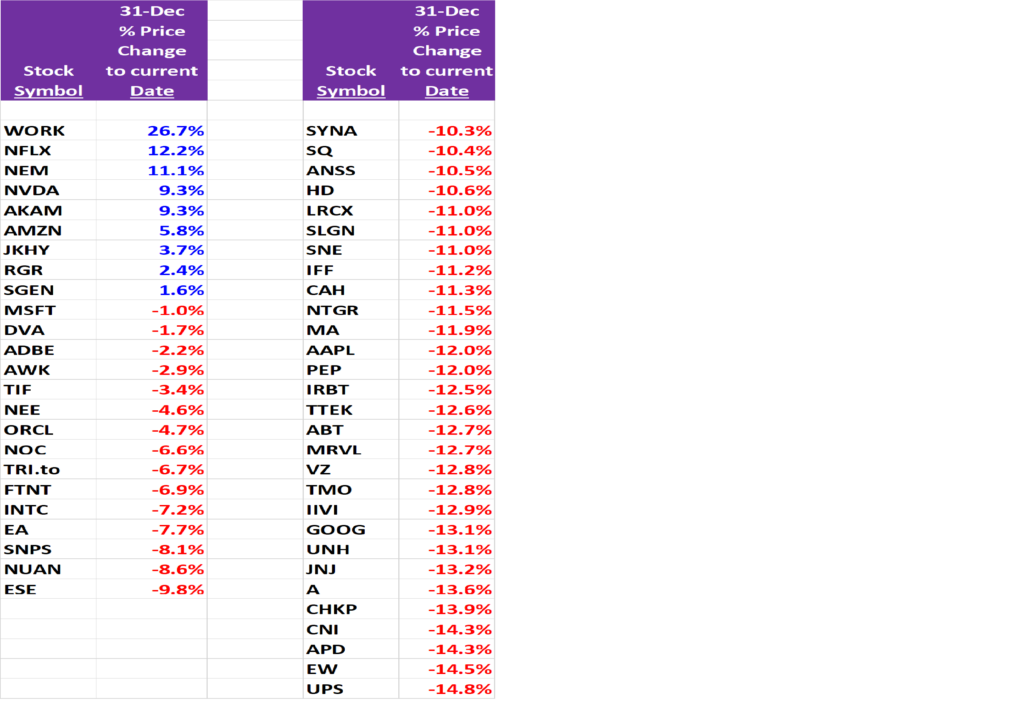
There are more than one set of factors that caused me to buy certain equities in the midst of the decline, while still reserving enough cash to make me feel comfortable. Principally, stocks like Microsoft, as an example, were now on sale, yet they could go even lower. The sale price interested me, but I needed more to begin to be a buyer. In the data above it is clear that the gov’t is pulling out all the stops to try and insulate the economy and society from the financial impacts of the health crisis. Further, businesses have plenty of inventory to address a short-term cessation of operations. Additionally, money is inexpensive to borrow, and will remain so until the economy shows signs of coming back on-line.
Finally, on a more macro-basis, my 187 Portfolio has moved from sell-signals to buy signals. At the end of December 2019, they were giving me strong sell signals. Today, the buy signals are there, but they are not at historic buy levels. They may or may not get to those levels and the choice of waiting to see if they get there before buying or to gradually begin buying given the favorable zone they are in is the decision I have wrestled with. I finally made the decision to buy the best of the best at current levels, levels that are 25% to 50% below recent high prices.
Below are two of many charts that inform me when current market prices of stocks within the 187 Portfolio present buying opportunities.
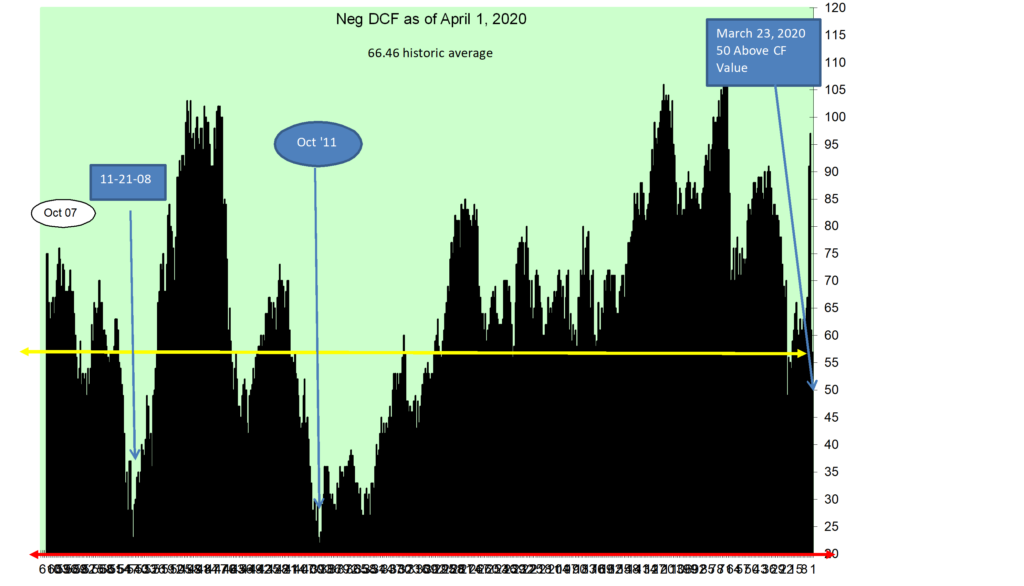
Price to Cash Flow

Strength of buying or selling opportunity

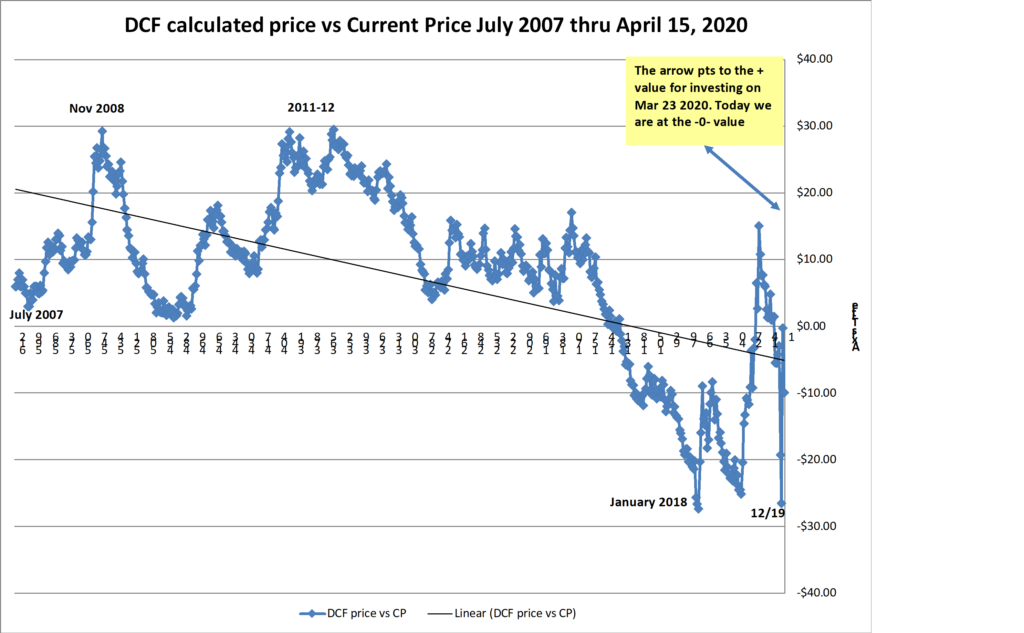
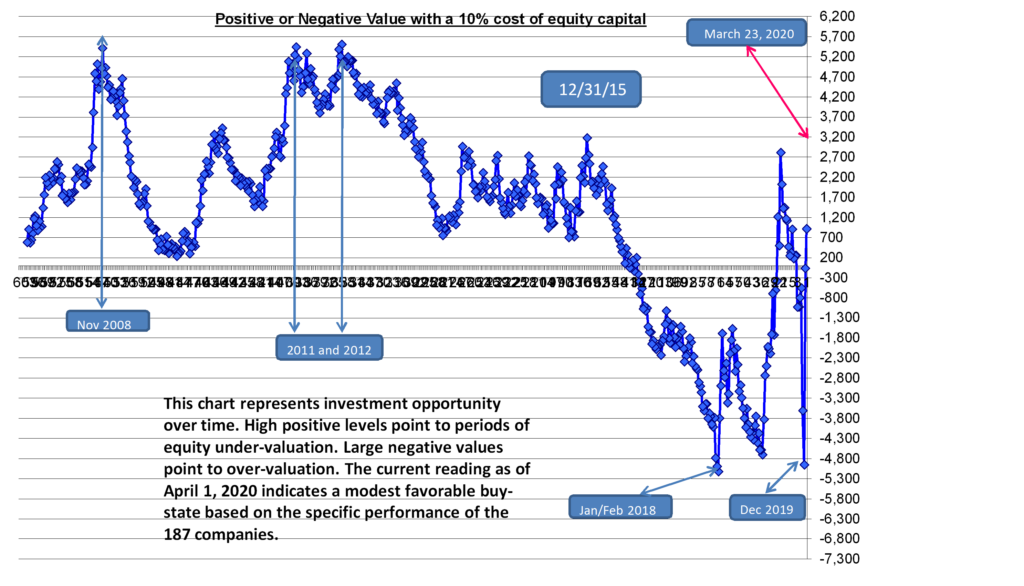
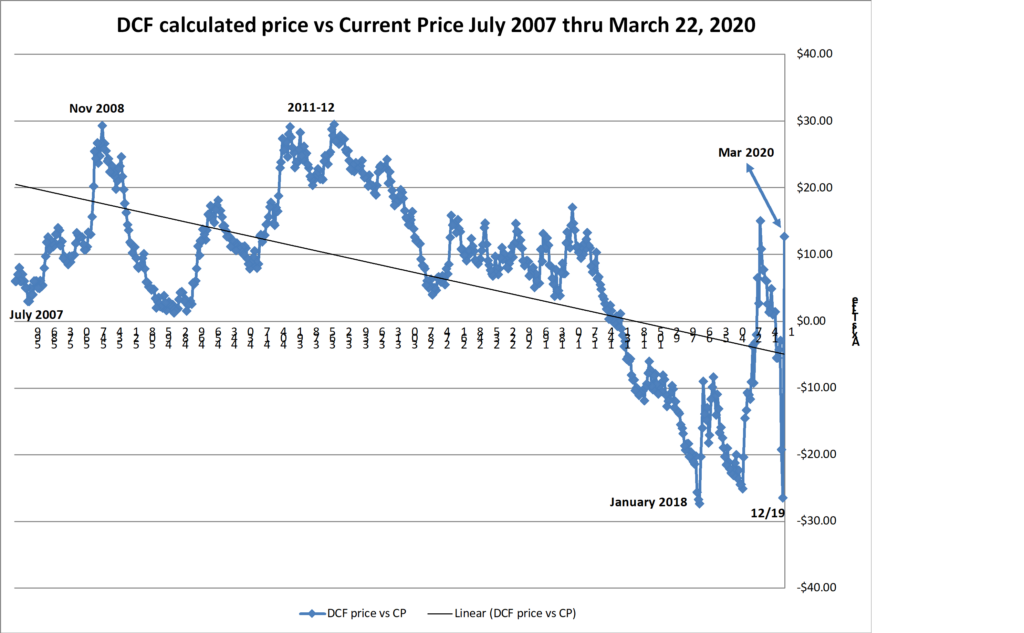
Another measure of value and investment timing that I look to is the comparison of a calculated price for each stock based on their future cash flow per share vs the current price.
The range of this calculated difference is +30 to -30. Positive differences are indications of value that are not appreciated by the market, while negative numbers are indications of an over-valued market where current prices are too high. Look at the chart below, and in particular the points and timeframes for the peaks and valleys. This is another example of why I sold in December 2019, and why I have started buying this past week.
Discounted Cash Flow of the 187 Portfolio vs the Current Price from 2007 through March 2020
The named entities and projects do not represent recommendations to buy or sell, or in any way intended to reflect investment advice. One of the key variables that is critical for deciding to invest is missing. That variable is a reasoned forecast of future asset performance vs the market. What is presented attempts to inform and to encourage research, to learn about each asset, and to come to an opinion of whether any of them or all of them strike you as being an important participant in the future development of asset platforms. Charts of technical price levels and movements are presented to educate those unfamiliar with price patterns. These examples of real price activity show how prior price levels may be used to identify market points of price resistance or support. Use this information as you see fit, but it is recommended that you see this as an educational/informative tool only. This information is only part of the array of focus areas needed in making any investment decision, accordingly, it is best to not rely on one type of analysis for your capital allocation decisions.